2017
Weak Calf Syndrome
Calving season provides all types of challenges for the rancher. Nothing is more frustrating than when a normally delivered calf is slow to get up and nurse. This could be due an extended labor, a large sized calf, a premature calf, cold weather, wind chill or other factors. Helping the calf nurse or providing colostrum replacement/supplement usually helps the calf eventually show some vigor.
However, sometimes the calf dies even with human assistance. While 5 percent death loss of the calf crop may be considered normal, it certainly is an economical loss. When losses are greater than normal, and they share the same symptoms of normally delivery and born alive calves but are weak and eventually die, it could be weak calf syndrome.
Weak calf syndrome is associated with reduced nutrition to the mother. Cows are usually in reduced body condition. A cow with a body condition score of 3 or 4 would have more incidences of weak calf syndrome than cows with more body fat. However, the lack of body fat isn’t the only issue involved, although it is a good physical sign to observe.
Adequate protein in the ration for the pregnant cow may help. A classical study by Bull and coworkers from the University of Idaho reported less weak calf syndrome with higher level of protein fed to the mother 60 days before calving. Late gestation rations with more than 10% crude protein had a 0.6% incidence of weak calf syndrome while rations less than 10% crude protein had 8.5% incidence.
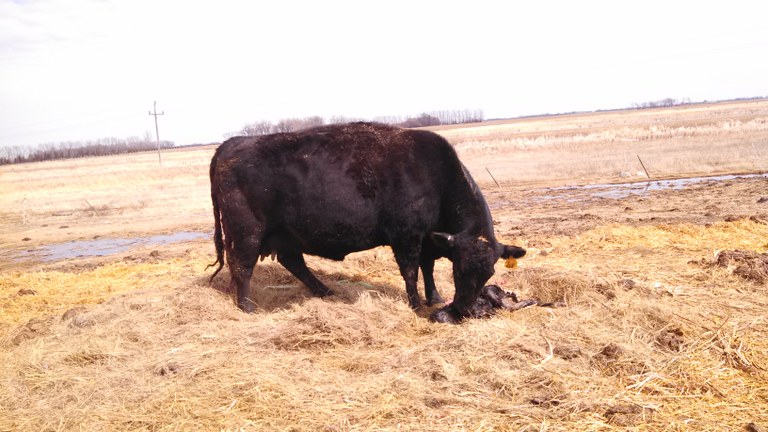
When protein content in feeds is low, it indicates other nutrients may also be less than required. These nutrients include energy, calcium, phosphorous, cooper, zinc, selenium, as well as other minerals and vitamins. Providing a vitamin and mineral supplement to pregnant cows is encouraged. Managing rations for increased weight gain (or avoiding weight loss) with extra protein and energy will help.
Weather stress can play into weak calf syndrome. A healthy, good conditioned cow fed a balanced ration can still give birth to a weak calf because of an associated weather event.
Issues that arise due to weather events may include:
- The cow has reduced feed intake due to a weather event that lasts longer than a day
- Combine that with the growing fetus and the increased energy and nutrient demand during the last few days or weeks of pregnancy
- Reduced feed intake due to the fetus competing with the rumen for internal body cavity space
- Reduced competition for feed during the last few days before calving
- Lack of bedding, windbreak or barn space to reduce nutrient demands due to stress as a result of adverse weather.
When the cow eats less nutrients, she has less nutrients available for the fetus. Adverse weather events might lead to weak calf syndrome since the mother may not be eating enough for two. Better nutrition during late pregnancy will help reduce weak calf syndrome.
Karl Hoppe, Ph. D.
karl.hoppe@ndsu.edu
Area Extension Specialist
Corn Stand Count Using Unmanned Aerial System (UAS) Collected Imagery
One of the goals for the UAS related research last year at the CREC, was to do stand counts on corn early in the growing season. A secondary goal was to identify appropriate flight height to acquire imagery to perform an accurate stand count.
For this study, we used an area of 0.99 acres (320 ft long by 55 corn rows wide) of a large corn silage field. The corn was planted on May 1, 2016 and was flown on May 23 at 50, 100 and 200 ft above ground level (AGL), using a UAS (AgBot) fitted with a multispectral camera (MicaSense RedEdge). The area was split into 16 plots (ranging from 10 ft long by 5 rows wide to 40 ft long by 20 rows wide), where we visually counted every single corn plant. In addition to those plots, we counted all corn plants in 10 rows up to 320 ft. Those numbers were used to ground truth the counts obtained from the UAS imagery.
At the end of the flights, the images were uploaded to Micasense’s cloud service, Atlas, where they were calibrated and stitched together to form one large image (orthomosaic). We then downloaded the orthomosaic onto our computer and used ArcGIS 10.4 software to calculate the Normalized Difference Vegetation Index (NDVI). We used NDVI to separate the corn plants from the remaining background. To decrease the “background noise” and increase counting accuracy, we grouped the corn plants in rows and deleted the plants between the rows.
Figure 1 shows a color RGB (Red, Green, Blue) picture (top) and an NDVI (bottom) orthomosaic of the study area. As one can see, it is hard to identify any corn plants (3 leaf stage) on the RGB imagery (at that zoom level). Meanwhile, on the NDVI imagery the corn rows become more noticeable. If we zoom in on the blue box (plot 16, 40 ft wide by 20 corn rows), one can clearly see the individual plants (Figure 2, left). Using the NDVI imagery collected a 50 ft above ground and tools in ArcGIS 10.4, we were able to identify (Figure 2, right) and count the plants in each plot first and then in the whole area (31,297 plants in 0.99 ac). We plotted the number of corn plants that we counted from the imagery versus the number of plants counted in the field for each plot. Figure 3 shows that there was a great correlation between the UAS imagery counting and the ground truth data (blue line); close to a 1:1 correlation (orange line).
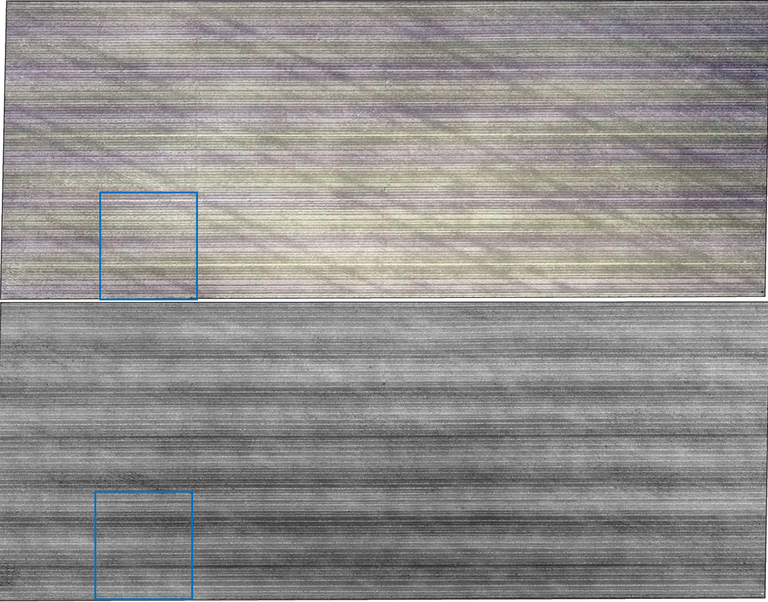
Figure 1. Corn study area (0.99 ac). Flown at 05/23/2016 at 50 ft above ground level. RGB mosaic (top) and NDVI mosaic (bottom). Blue box represents the location of plot 16 (in detail below).
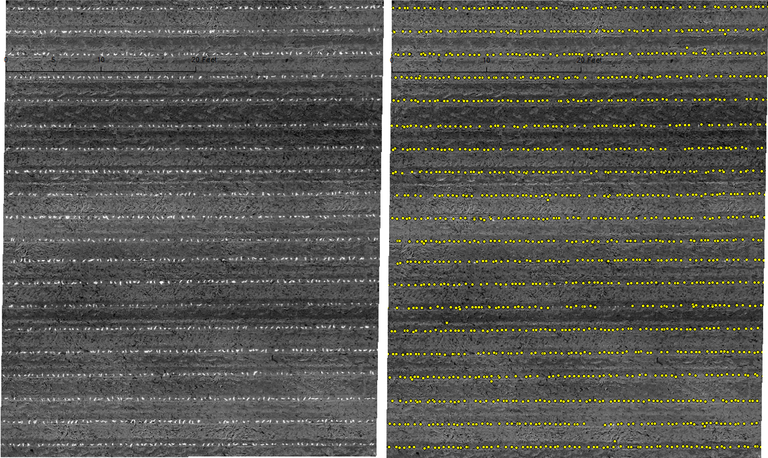
Figure 2. Detailed view from plot 16 (40 ft wide by 20 corn rows). NDVI mosaic (left) and plants detected by ArcGIS software (right).
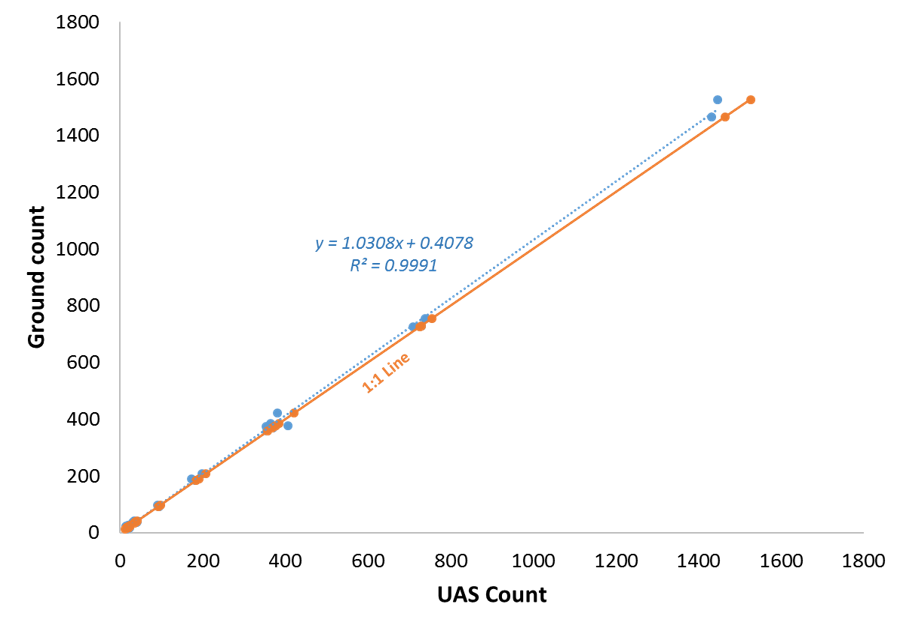
Figure 3. Correlation between stand count from UAS imagery and stand count on the ground (blue line).
In addition to stand count, our method allowed us to locate and count both skips and doubles and to evaluate plant distribution uniformity across the field.
For the 2017 growing season, we are planning on testing the method using a different copter fitted with a higher resolution camera, which will allow us to fly higher and cover more area per flight and further investigate the determination of doubles and skips.
Paulo Flores, Ph. D.
paulo.flores@ndsu.edu
Precision Agriculture Specialist
Can Synbiotics Be Used As Production Enhancers?
High-grain finishing diets can induce ruminal acidosis and other nutritional stresses which can lead to other health disorders in feedlot cattle. Ruminal acidosis is an important nutritional problem in feedlot cattle and is associated with a decrease in ruminal pH and an increase in lactic acid and volatile fatty acid concentrations. Negative impacts of ruminal acidosis are erratic feed intake, decreased performance, and liver abscesses. To minimize the negative impacts of ruminal acidosis, cattle feeders use different feed additives like ionophores, buffers, probiotics, and essential oils in their diets. Probiotics (naturally occurring bacterial supplements) have been used in the feedlot to reduce the risk of ruminal acidosis and studies have shown that combining probiotics with prebiotics (food ingredients which selectively stimulate the growth or activities of beneficial bacteria) had synergistic effects in dairy and beef calves. Feeding synbiotics (a combination of pre- and probiotics) can help stabilize rumen pH to decrease acidosis, and thus improve production and animal health.
At the CREC, we recently completed a metabolism study to evaluate the effects of synbiotics on ruminal fermentation in cannulated steers fed high grain diets. Three synbiotics (hydrolyzed yeast + live yeast (LYHY)), Celmanax (prebiotics) + live yeast (CLY), Synerall (a commercial pre- and probiotics product, SYN) and a control treatment (CON, no synbiotics) were used for the rumen fermentation study.
Addition of synbiotics had no effect (P > 0.05) on ruminal pH although values for the synbiotics treatments were numerically higher compared with the control treatment. For beef cattle in the feedlot, higher pH is desirable to minimize incidences of acidosis. Typically, ruminal pH of 5.6 is regarded as the reference point for chronic acidosis. Although cattle may look healthy at this pH level, dry matter intake and performance are negatively affected. Ruminal pH value for the control treatment (5.56) was below the reference point compared with higher pH values (5.62) for the synbiotics treatments (Figure 1).
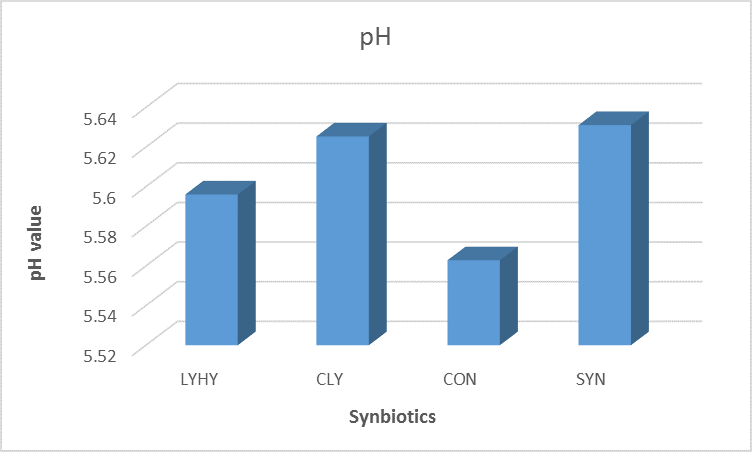
Figure 1: Effects of synbiotics on average pH values of ruminal fluid sampled on day 15 to 21.
Inclusion of synbiotics resulted in greater (P = 0.019) acetate-to-propionate ratio compared with the control (1.41 vs. 1.23), indicating a more stable fermentation in the rumen. Based on the results, the LYHY treatment was selected because it had the lowest numerical acid load (total VFA + lactic acid; Figure 2) compared with the other treatments and is currently being used in a feedlot finishing study to determine its effects on dry matter intake, daily gain and feed efficiency.
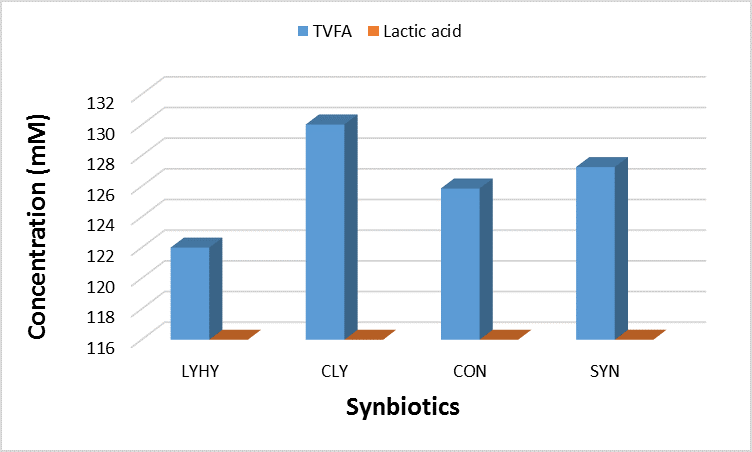
Figure 2: Effects of synbiotics on lactic acid and total volatile fatty acid (TVFA) concentrations.
We plan to do two more studies on the use of synbiotics in the feedlot and will be sharing the results at a later date.
Uche Anele, Ph. D.
uchenna.anele@ndsu.edu
Animal Scientist
Beef on Rye: Not Your Conventional Reuben!
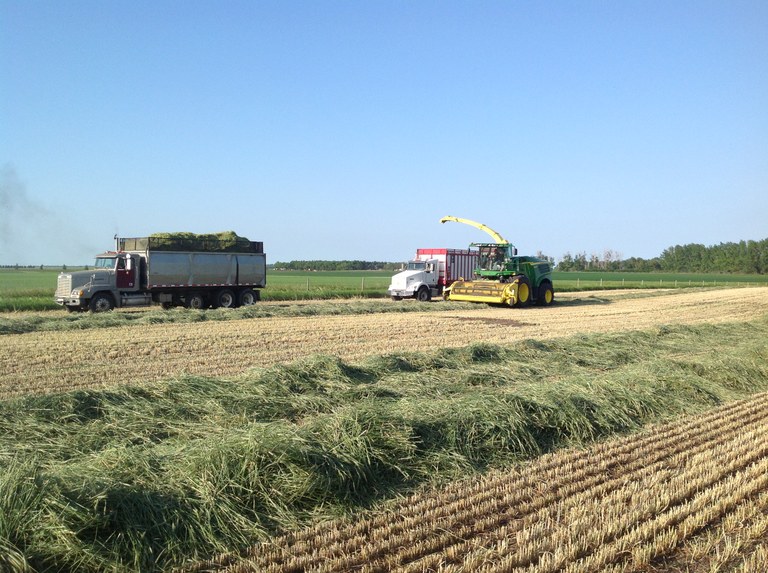
In the fall of 2015, 30 acres of Rymin winter rye was planted at the CREC. The objective was to harvest the rye for silage in the spring and feed it to yearling steers in a research trial evaluation comparing rye silage to corn silage. As planned the rye was cut, wilted, chopped, and bagged for silage on June 16, 2016. The rye yielded 3.5 tons/acre of dry matter and averaged 39% dry matter. The bagged silage was allowed to cure for three weeks before feed-out began. The corn silage was also grown at the CREC and was harvested in the fall of 2015 and stored in a bunker silo.
The 97 day feeding trial utilized 71 head of Angus and Angus cross steers, from the Angus University Feed-out program, with an average initial weight of 990 lbs. To fairly compare corn and rye silage, the amount of corn grain to forage in the corn silage was estimated to be approximately 50% forage and 50% corn. The nutritional profile of both silages can be viewed in Table 1. The silage and corn inclusion levels were adjusted in the rye and corn silage treatment diets to offset the amount of corn grain estimated in the corn silage. The Rye silage and corn silage treatment diets were formulated to be similar in crude protein (14%) and energy (net energy for gain; 0.61 Mcal/lb; table 2).
The rye silage and corn silage treatments resulted in similar final body weights (1490 lbs), dry matter intakes (29 lbs/hd/day), overall average daily gains (5.0 lbs/hd/day), and overall gain to feed (0.17 lbs gain/lb of feed; Table 3). Rye and corn silage treatment diets also resulted in similar carcass characteristics (Table 4).
This trial demonstrates rye silage is a forage source that can be effectively used in steer finishing diets with corn and modified distillers grains. Winter rye is a crop that can fill the gap for forage needs between corn silage harvests. Additionally, previous work at the CREC has documented the flexibility of winter rye for use in double cropping systems in North Dakota. (https://www.ag.ndsu.edu/CarringtonREC/documents/agronomyrd/docs2014/2014-double-cropping-annual-forages/view ).
For additional information on winter rye: https://www.ag.ndsu.edu/CarringtonREC/agronomy/crop-index/rye
For variety trial information: https://www.ag.ndsu.edu/varietytrials/winter-rye/carrington-rec
Chanda Engel
Chanda.Engel@ndsu.edu
Livestock Research Specialist
Deciding when to sell calves? Calculate the value of additional gain.
Cattle feeding has many variables to manage. How many days on feed or to what weight do we feed the calves are questions that every backgrounder deals with. The value of additional gain can be reviewed to access profitability and when to market calves.
Traditionally, the calf market price per pound decreases as cattle get heavier. February 2017 is no exception.
Using the value of additional gain can help decide when to sell calves. When the value of the additional gain is positive, feeding to a heavier weight is a good option. When the value of additional gain is negative, it’s time to minimize loss and consider selling.
To calculate the value of additional gain, weights and prices for various sizes of cattle are needed. Table 1 uses North Dakota sale barn prices and corresponding weights reported February 9, 2017. https://www.ams.usda.gov/mnreports/sf_ls764.txt
Also required is the additional cost of gain for the cattle being backgrounded. Feed cost of gain for calves gaining 3 pounds per day was calculated at $.32 per pound. Total cost of gain was calculated at $.48 cents per pound of gain. Since each feedlot has its own cost structure, the total cost of gain should be used for that feedlot and the type of cattle and ration being fed.
Table 1. Value of additional gain for backgrounded steers.
Since the value of the additional gain is greater than the cost of gain, feeding to a heavier weight is profitable at these prices.
However, if the market drops $5 across all weights during the next 2- 3 week feeding period, the value of additional gain is positive in only two of the weight ranges as compared to when the calves could have been sold.
If the calves were purchased, using the actual purchase price for the calves would be preferred. Please consider season trends where heavier weight and/or fleshy cattle can be additionally discounted.
These calculations can be useful in evaluating premiums or discounts for certain weight ranges and determining target weights for selling calves.
Karl Hoppe, karl.hoppe@ndsu.edu
Area Extension Livestock Specialist
Stats for the Rest of Us…How to Read Your Annual Report
Difficult though it may seem to many of us, statistical analysis is a fundamental tool that researchers at the CREC use on data to develop conclusions which helps identify whether treatments affect yield, gain, etc., or not. Data usually comes from experiments where scientific approaches test variables (fertilizer, variety, herbicides, soil tillage, feedstuff, diets, components in a diet, etc.) and measure crop (yield, protein content, height, etc.) or livestock (daily weight gain, carcass weight, marbling, etc.) response to those variables (called treatments). Among them is a control (or check), to which the others are compared. Treatments are applied to experimental units (plots). For livestock experiments, a plot could be a pen with 10 steers in it, or each individual steer in the pen. For crop trials, we usually use field plots, which can vary in size from a few square feet to a few acres.
Experimentation has two basic principles: replication and randomization. Replication means that treatments within our trials are typically exist three to six times within a trial (i.e. treatments are replicated 3-6 times). This helps determine a true average for a treatment. Randomization means that plots are placed randomly throughout a trial area to avoid instances where some treatments experience better conditions than others due to location variability.
Table 1 is from a trial completed at the CREC in 2016. The first column lists the treatments (rates of nitrogen) and “Check.” The remaining columns are variables potentially affected by the treatments. Table 1 summarizes the data from the study by using the mean (of four replicates) for each treatment.
These statistical terms are crucial to interpreting the results of any trial.
- Mean - is the same as average. The values presented for each treatment are the mean of 4 replications of that treatment within the trial.
- Standard deviation (SD) - a measure of the variation within a set of data values. A low SD indicates that values cluster close to the mean, while a high SD results from values spread over a wide range from the mean.
- Coefficient of Variation(CV) – the CV represents the SD of a data set as a percentage of the mean (CV= [SD/Mean]*100). A higher CV means there is more variability within the data set whereas a low CV means the data is more consistent. The green box in the table demonstrates that “Yield” and “Grain N-uptake” show the largest CV values and thus more variability in the data.
- P-value - if the p-value is less than or equal to the chosen significance level (typically 5%), it means that you are at least 95% confident that two treatment means are different, but it does not tell which treatment is better or worse. For that we use other statistical tests, such as the least significant difference.
- Least Significant Difference (LSD) – takes into account variability within a trial to calculate whether means are truly different by identifying the smallest (statically) significant value that is used to compare means. Any difference larger than the LSD value is considered significant (see LSD values (blue box) for “Flag leaf nitrogen” and “Grain protein” in Table 1). Notice that the means for those variables are followed by lower case letters. The way to read this is if two means are followed by the same letter they are not significantly different (purple box). When the difference between two means is smaller than the LSD value, the difference is called not significant and the LSD is usually represented by the letters “NS” (see LSD values for “Yield”, “Test Weight”, “250 kernel weight”, and “Grain N-uptake” in Table 1, gold box), and no letters are written behind the mean values since they will all be identical.
Actual table from the 2016 CREC Annual Report page 13:
Our hope is that this helps clarify things when you’re reading the Annual Report or listening to one of us present during a meeting. If you have questions about how to read something or what we’re trying to convey, don’t hesitate to contact us. You can request a printed copy of the CREC 2016 Annual Report by contacting us. We’re all available at 701-652-2951.
Organic Onion Evaluation
The organic project at the Carrington Research Extension Center (CREC) is diverse and attempts to examine and serve multiple types of farming scale and marketing operations. This is accomplished with a broad range of topics through field research and the extension of information at the center. One area of field trial research that has recently been conducted on the certified organic land is onion trialing. The research is aimed at local food production, although data is still applicable to organic field scale production.
Local food production is quite evident in North Dakota with the growing interest in the development of farmers markets, CSA’s (Community Supported Agriculture), and buying clubs that have direct sales of produce, meat, eggs, baked goods, and more to the community. Local food grown on a limited acreage with direct marketing allows new personnel to begin farming where they otherwise may not be able due to the high cost of land and equipment associated with modern agriculture. This not only adds economically back to the local community, it has sociological implications as well by putting more people back on the land and keeping our schools and main streets open!
A field trial of organic yellow storage onion cultivars was conducted in 2016 at the CREC to look at the potential of this idea. All entries were F1 hybrids with the exception of one OP (open pollinated) variety. The OP variety, Dakota Tears, is a FDV (Farmer Developed Variety) that was bred by a local farmer, and is marketed nationwide through their own Seed Company, and seed catalogs across the United States. Seeds were planted in the CREC greenhouse on March 7 and seedlings were transplanted to the field on May 18-19. The previous crop was a radish cover crop evaluation trial. Row spacing was 24” with a 4” plant spacing using a single row arrangement. The trial was managed as dryland.
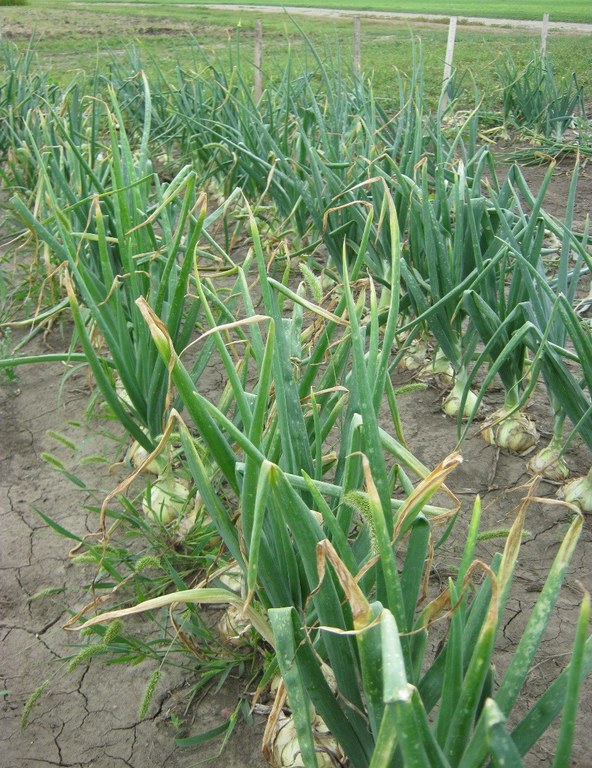
Picture 1. Entries growing in field on August 25, 2016.
Data gathered from this trial is not presented due to space limitations although the complete data table is available on the NDSU: CREC variety trial website. To summarize the results, a standard measure of maturity in onions is when 75% of the tops have tipped over indicating they have stopped growth and are in the process of drying down for harvest. Entries in this trial ranged from 94 to 109 days after transplanting for this parameter. Harvest dates ranged from the earliest entries on August 19 to the latest entry on September 12.
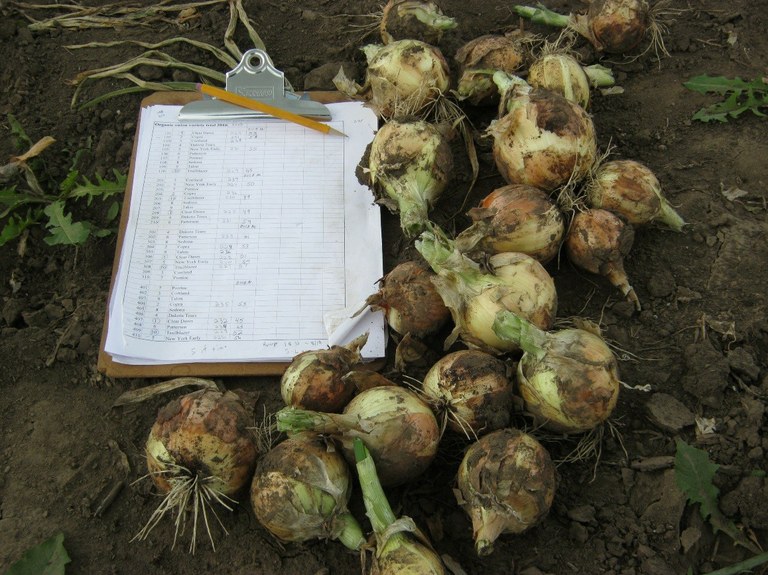
Picture 2. Field harvest of an early entry on August 25, 2016.
Harvest yields are determined by grading, sizing, and weighing each of the components. Yields are reported in cwt/ac, or hundred weight per acre. Think of hundred weight as a one hundred pound bag of onions. The onions were divided into standard sizes of: >4”, 3 to 4”, 2 ¼ to 3”, 1 to 2 ¼ “, <1”, and culls which are unsaleable onions. The majority (mean yield of 72 cwt/ac) of the onions were in the 2 ¼ to 3” size range, although sizes differed by each of the entries. Sedona had the greatest total yield of 288 cwt/ac, which adds up all of the various sizes. Sedona also had the highest yield of 198 cwt/ac in the 3 to 4” size. There were no onions >4” with the exception of Dakota Tears which had 2 cwt/ac for this size.
For the complete data set please use the below link:
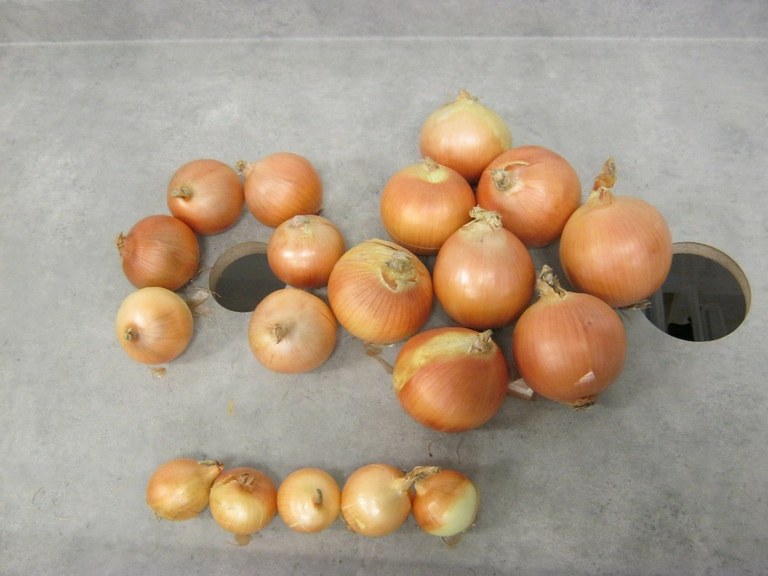 Picture 3. Dried onions on the grading table showing sizes, clockwise 1 to 2 ¼ “, 2 ¼ to 3”, and 3 to 4”.
Yields achieved from this dryland organic trial are not as high as conventional irrigated yields gathered from previous research trials, however it is felt that the premium received is competitive and sustainable in many ways and is an alternative method of growing and marketing onions.
Steve Zwinger
Agronomy Research Specialist
Steve.Zwinger@ndsu.edu
Steve Schaubert
Research Technician
Is My Compost “Contaminated”?
Herbicides are a common and widely accepted tool used to control weeds or undesirable vegetation. Persistent herbicides are long-acting herbicides used on hard-to-control weeds, often broadleaves. This type of herbicide may be used on grain crops, lawns, pastures and hayfields to successfully control weeds, year after year.
While persistent products are praised by many because of their effectiveness, they are also cursed by many…because of their effectiveness. Typically those cursing don’t know they are dealing with a persistent herbicide until damage to desirable plants occurs. When we paint a fence we can see the paint persists for many years; however when we spray weeds we do not see the herbicide persist in the soil or on the plant vegetation.
These products only become an issue when either crop rotation restrictions are not followed (field scale) or you use “contaminated” compost in your vegetable plots, garden, high tunnel, etc.
So how do persistent herbicides end up in compost? If you follow the graphic provided on the label of Milestone® (https://s3-us-west-2.amazonaws.com/greenbook-assets/L79495.pdf) you will see that when the herbicide is applied to either a hayfield or pasture and consumed by an animal it simply passes through the animal (no harm done to the animal) and remains effective (no harm done to the herbicide) in the manure. If this “herbicide-contaminated” manure is applied to any broadleaf crop damage may occur. Composting the manure does not lessen the persistence of every herbicide either. So when “contaminated” compost is applied to vegetable plots, gardens, etc. the outcome for sensitive crops (beans, tomatoes, potatoes, peppers) is stunted growth and decreased yields, and possibly death. Keep in mind that manure from herbicide-treated crops can be managed by following herbicide-specific label instructions.
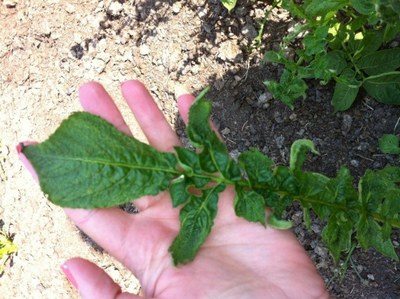
Example of plant damage resulting from application of manure containing a persistent herbicide. Photo from NDSU Sheridan Co. Extension office.
How do you know if your field is ready to plant? You should always follow label instructions and rotation restrictions. You may also follow the Field Bioassay Instructions found on page 101 of the 2017 ND Weed Control Guide. For some herbicides, dilution of the product in the soil by way of tillage is another method to reduce the risk of carryover (page 100-101).
How do you know if your compost is herbicide free and ready to use? You can conduct a simple plant bioassay by following these steps from Washington State University: https://puyallup.wsu.edu/soils/wp-content/uploads/sites/411/2014/12/PDF_Clopyralid_Bioassay.pdf. Dow AgroSciences offers a testing protocol as well: http://www.manurematters.com/na/en/bioassay.htm. If you find that you have residue issues you can possibly use dilution as a means of mitigation here too, depending on the concentration of residual.
Whether you’re working with persistent herbicides on a field-scale or in your garden, it’s important to follow label instructions, rotation restrictions and inform those who may purchase hay, manure or compost from you about what you have used. Great stewardship will keep all of our plants growing!
Mary Berg
Area Extension Specialist
Livestock Environmental Management
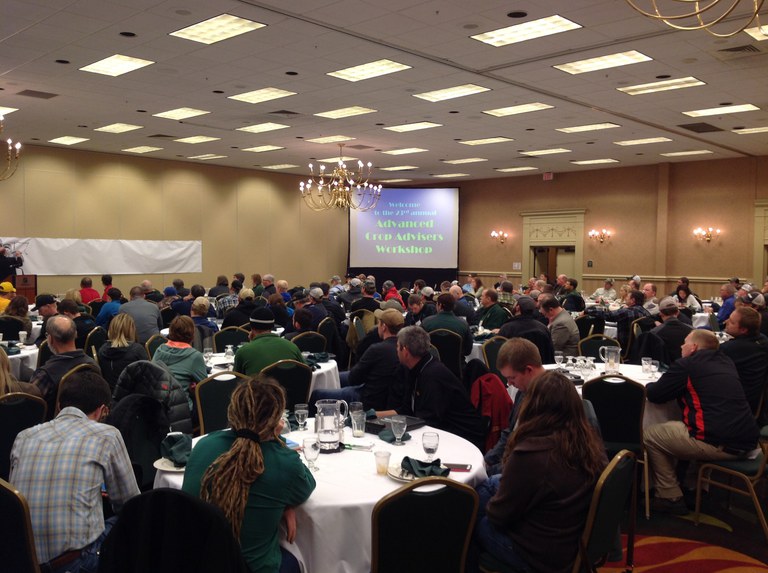
Advanced Crop Advisers Workshop Set for Feb. 28 – March 1 in Fargo
The 2017 Advanced Crop Advisers Workshop is scheduled for February 28 through March 1 at the Holiday Inn in Fargo.
The workshop is designed to provide in-depth discussion of selected topics for agricultural professionals to enhance their crop production recommendations for farmers.
The event is organized and conducted by the North Dakota State University Extension Service and University of Minnesota Extension.
February 28 educational sessions are:
- 2017 Outlook for farm profitability: Agricultural lien’s impact on your agronomy business
- Herbicide and weed control considerations with cover crops
- Successful no-till systems in high-clay soils
- Some plant disease here and a few insects there
- Utilizing Iowa experience to assist us with managing herbicide-resistant weeds
Also, the presentation “NDSU football – Ag influence” will be given during lunch.
March 1 educational sessions are:
- The route to pesticide and plant trait labeling
- Opportunities with nonherbicide-tolerant crops on a farm’s long-term weed management
- Neonicotinoid insecticides: Balancing pollinator protection and insect management
- Insight on corn silage hybrids and salt-tolerant alfalfa varieties
- Mining field data to discover increased crop value
Preregistration is required by Feb. 20. The workshop fee is $140, or $75 if attending one day. The fee includes three meals and refreshment breaks, and reference materials. The workshop is limited to 150 people. Preregistrations will be accepted on a first-come basis. Walk-in registrations during the workshop will not be accepted.
Certified crop advisers will have the opportunity to receive 11 continuing education units.
A brochure that contains workshop details, including a preregistration form, is at https://www.ag.ndsu.edu/CarringtonREC/events/2017-advanced-crop-advisers-workshop-2. Electronic preregistration and credit card payment can be made on the webpage.
For more information, contact Greg Endres at the NDSU Carrington Research Extension Center at (701) 652-2951 or Phillip Glogoza, Minnesota Extension Service in Moorhead, at (218) 236-2008.
Greg Endres, Area Agronomy Specialist
Gregory.Endres@ndsu.edu
Yield Increase and P Removal by Spring Wheat on a Sandy Loam Soil in the Red River Valley
The importance of phosphorus availability in spring wheat during early spring cannot be over emphasized in the Northern Prairie Region where the soil does not heat up fast enough to speed up mineralization of P in soil. This is important for no-till farming and in prolonged cool and wet spring conditions after seed emergence.
A study was conducted in 2016 to assess the response of four wheat varieties to 40 lbs of P2O5 (as triple super phosphate) on a fine sandy loam soil in the Red River Valley of Minnesota. Soil test P was 8 ppm and soil organic matter was 5.2%. Two main observations from the study were:
- Yields responded significantly to P applied. Yield difference between the untreated (control) and treated plots were significant for each variety (Fig 1.) Different letters for the same variety mean the yields were significantly different. Yield increased by 6.5 bushels on average per variety. It must be noted that significant yield differences between varieties were primarily due to the respective yield potentials.
- Total P removed in the grains was not significantly different between the control and 40 lbs P (Fig 2). This suggests that when P was needed for growth and development (tillering) early in the season the 40 lbs treatment of P had begun impacting yield until P availability increased from mineralization later in the season when the impact could not be reversed. On average, about 0.4 to 0.5 lbs of P2O5 was removed by the grain to produce a bushel.
The important message here is that even though P deficiency is not easily noticeable, except in more severe conditions from stunted growth, P deficiency can seriously impact yields. Because profits from P application are tied to fertilizer and grain market prices, consult the NDSU wheat fertilizer recommendation to help in your P application decisions for the upcoming growing season: https://www.ag.ndsu.edu/pubs/plantsci/soilfert/sf712.pdf
Thank you to the Minnesota Wheat Research and Promotion Council for funding this research, Mr. Ken Asp (producer), and Dr. D. W. Franzen for permission to use the web link.
Jasper M Teboh, Ph. D.
Soil Scientist
How Do Wheat Herbicides Affect Fall Cover Crops?
Here’s a new perspective on cover crops for the New Year.
Wheat offers the best opportunity for North Dakota producers to plant cover crops, with a large diversity of species options. One problem that occurs is that many common wheat herbicides have crop rotation restrictions of 4-18 months to many crops. How safe is it to plant a cover crop in that case? Herbicide labels do not have enough information to confidently make cover cropping decisions. In 2016 a study was conducted to answer this question at three locations in North Dakota. Nine herbicides were used which have the potential to still have a residual around 60 days after application. A diversity of active ingredients was chosen. Cover crop injury was grouped by risk. For cover crops we are assuming that most people would be comfortable with 20% or less injury to the crop so we call this ‘low risk’ (LR), which is our safest rating. If any herbicide caused 21-50% damage we are calling it ‘medium risk’ (MR) to the cover crop. If there was over 50% damage, the herbicide and cover crop combination was deemed ‘high risk’ (HR). The word risk is used since one of the locations saw no injury from any of the herbicides. To account for this, I took a conservative approach and summarized the data based on the highest amount of damage recorded at any location. The Carrington location saw the most damage, followed by Hettinger with only marginal cover crop injury, followed by Fargo with no injury. Injury levels will vary based on organic matter, soil texture, rainfall (and soil moisture), and temperature. Seed for this study was donated by Pulse USA.
Risk of cover crop injury based on highest damage recorded between Carrington, Fargo, and Hettinger, ND
Mike Ostlie, Ph. D.
Research Agronomist
When Disaster Hits the Cow Herd
Winter in the Northern Great Plains is inevitable. It will be cold and it will snow. The question is how much and for how long. A 2-3 day blizzard started on December 5, 2016 followed by subzero temperatures the following week. Another blizzard hit on December 26, 2016. Snow falls are hard to measure with 30-60 mile per hour winds. However, the height and width of the snow drifts are impressive.
In severe winter storms, blizzards, and extreme cold, all cattle are stressed. Although most healthy cattle can handle these uncomfortable storms sometimes they can’t survive. The old, weak, and young are particularly susceptible to stress in bad weather. Placing cattle in barns may help but keep in mind during a blizzard, snow can fill up a barn and cattle can get buried in the snow. The hot, humid air quality in a barn may lead to pneumonia which can be far worse for animal health than standing outside in a blizzard.

Death losses due to weather related disasters can have a huge financial impact on cattle producers.
The Livestock Indemnity Program (LIP) was authorized by the 2014 Farm Bill ‘to provide benefits to livestock producers for death losses in excess of normal mortality caused by eligible adverse weather, eligible disease and eligible attacks’.
LIP payments are based on 75% of market value as determined by the Secretary of Agriculture for the year of the loss.
For cattle, a Notice of Loss (form CCC-852) must be filed with the local Farm Service Agency (FSA) office within 30 days of when the loss was apparent. The Application for Payment must be filed within 90 days after the end of the calendar year in which the eligible loss condition occurred.
Losses that are payable are only in excess of Normal Mortality. Since you don’t know when disaster may strike, it is prudent to take a picture of all dead livestock as proof of loss. This includes all cattle that die throughout the year regardless of the reason.
Normal Mortality is different for various groups of cattle. For North Dakota, normal mortality is:
| Age Class | Normal ND Mortality (%) |
|---|---|
| Adult Cows | 1.6 |
| Adult Bulls | 2.0 |
| Calves (<400#) | 4.6 |
| Calves (400-799#) | 1.5 |
| Calves (>800#) | 1.0 |
For more information about the Livestock Indemnity program, go to the 2016 fact sheet https://www.fsa.usda.gov/Assets/USDA-FSA-Public/usdafiles/FactSheets/2016/lip_fact_sheet_2016.pdf
Also, contact your local FSA office for more information and to apply. To find your local FSA county office, visit http://offices.usda.gov.
Continue to be safe as we weather this winter together.
Karl Hoppe, Ph. D.
Area Extension Specialist, Livestock Systems


