2015
Bred Heifers – Figuring a Fair Price
With the drastic down turn in the Fed cattle market, the prices for other classes of cattle have decreased. While some short term rebound in prices may occur, long term outlook is for increased supply and prices trending lower.
Auction market prices for bred heifers indicate there is strong optimism in the cattle industry. However, prices have fallen as compared to peak prices in 2014-2015 bred heifer sales.
To figure what is affordable requires some estimation on future costs and prices. At the recent Central Dakota Ag Day, three methods for calculating bred heifer prices were shown. These calculations resulted in similar values for bred heifers. One approach to bred heifer pricing used the following assumptions:
1) Costs to maintain a cow per year:
- Pasture ($252.00) + Winter Feed ($270.00) + Yardage ($90.00) = $612 per cow yearly based on actual costs determined by North Dakota Farm Business Management (http://www.ndfarmmanagement.com/)
2) Cow Longevity:
- 15.16% replacement rate; 5.7 year average cow age based on ‘CHAPS’ Cow herd Appraisal Performance Software by the North Dakota Beef Cattle Improvement Association (http://www.chaps2000.com/)
__________________________________________
Cow Longevity Example
*15% replacement rate per year
After 1 year 85 head left
2 years 62 head left
3 years 53 head left
4 years 44 head left
5 years 38 head left
6 years 32 head left
7 years 27 head left
8 years 23 head left
9 years 20 head left
10 years 17 head left
Average age for cow leaving herd: 5.2 years
_________________________________________
3) Cull cow income:
- 1300 lb. cull cow at $70/cwt = $910.00/head
4) Calf income:
- Average weight calves sold = 594 lbs. (2014 ND Farm Business Management)
- On 12-15-2015 CME Feeder Futures Nov 2016 $142.85
- On 12-23-2015 CME Feeder Futures Nov 2016 $154.15
- Estimated price for 600 lbs. feeder calves = $162.00/cwt or $972.00/ head
5) Income over lifetime:
- Number of calf crops/cow
- 4.7 (5.7-1 = 4.7; heifer doesn’t calf until 2 years of age)
- 4.7 calf crops at $972.00/calf = $4568.40
- Cull cow
- 1300 lbs. at $0.70 = $910.00
- Total
- $5478.40
- Adjust for death loss (3%)
- $5314.05
6) Expenses over lifetime:
- Pasture
- $252.00*4.7 = $1184.40
- Feed
- $270.00*4.7 = $1269.00
- Yardage (includes breeding and vet)
- $90.00*4.7 = $423.00
- Total
- $2876.40
7) Value of a bred heifer:
- Income = $5314.05
- Expenses = $2876.40
- Net = $2437.65 (value of a bred heifer)
8) Do you want to budget in profit required?
- Yearly profit needed
- $200.00/head? ($200.00*4.7 = $940.00)
- Net = $1497.65 (value of a bred heifer with $200.00 budgeted profit)
9) Need to deduct interest expense if borrowed money:
- $1497.00 at 5% = $74.88/year
Bred heifer prices for December 2015 are presently ranging between $1700 - $2500/head based on weight, quality, breed, AI bred and other factors.
Karl Hoppe
Extension Livestock Specialist
Organic fingerling potato variety trials
What are fingerlings?
Fingerling potatoes are small, elongated potatoes that are typically 1 to 2” in diameter and 2 to 5” in length resembling fingers, hence the name. These potatoes are mature when harvested and not to be confused with new potatoes, which are young potatoes that are harvested before they are mature. These potatoes are in demand with chefs and market farmers for their unique flavors and textures. Fingerling potatoes can be smooth or knobby and come in variety of colors and names from the yellow-skinned Russian Banana, the pink skinned French variety, to the purple skinned Purple Peruvian to name a few. Most fingerlings may be referred to as heirloom or folk varieties, although current plant breeding efforts are developing new varieties.
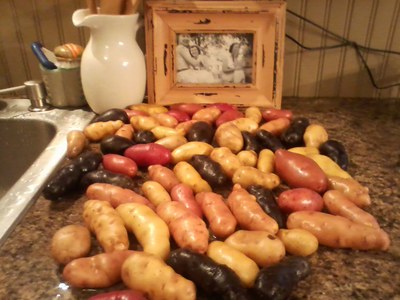
Assortment of fingerling potatoes from the CREC 2015 organic variety trial.
Field trial results
The CREC has evaluated specialty organic potatoes each year since 2005. During the 2013-2015 growing seasons 14 fingerling varieties were trialed at the center with Yukon Gold or Red Norland used as check varieties. Objectives of these trials were to determine the adaption and quality of these potatoes along with varietal comparisons in a dryland organic environment. Field trials were planted mid-May each year of the study. Harvest dates were late-September to early October, demonstrating the late maturity of this type of potato. Data gathered show days to brown vine, or dry down, range from 110 to 132 days, as compared to check variety Yukon Gold with ~100 days to dry down. Tuber weight, the average weight of an individual potato in grams for the three year period is 60 grams or ~ 8 potatoes per pound compared to Yukon Gold at 157 grams or less than 3 per pound. Yield data gathered from the last three years at the CREC demonstrate the yield potential of fingerlings to be lower than Yukon Gold. The average yield for Yukon Gold is 177 cwt/ac, or 177 hundred pound bags of potatoes per acre. The highest yielding fingerlings were Russian Banana, Red Thumb, and Austrian Crescent at 153, 148, and 138 cwt/ac respectively. Yields presented are total yield/ac with no grading or culling. Data gathered demonstrate the lower yield potential of fingerlings along with information to make varietal comparisons. To view complete data sets from individual field trials please click on the links below.
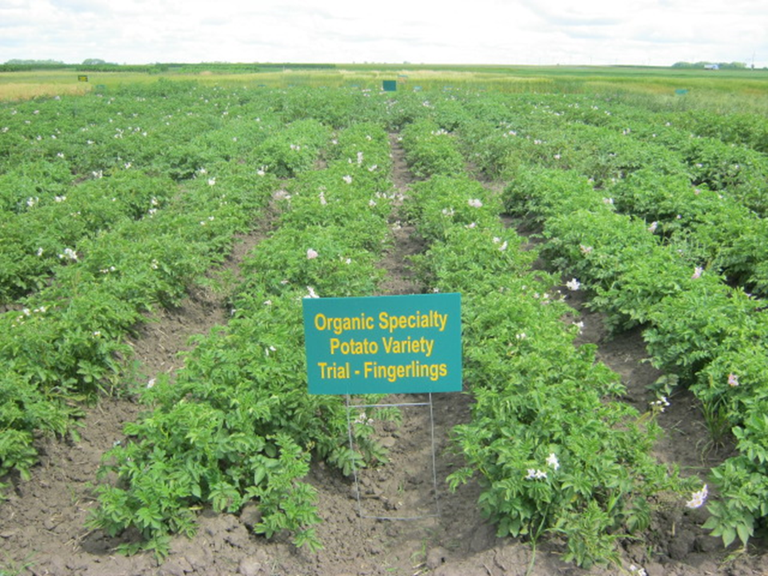
2014 trial in bloom.
Taste testing
To determine differences in overall quality a taste test was conducted from the 2014 crop by Dr. Abby Gold on the NDSU campus. Eleven varieties of fingerlings and Yukon Gold were evaluated for appearance, texture, tenderness, flavor and overall quality. Preliminary results rated Ozette and Butterfinger best for overall quality with Austrian Crescent being close behind. Russian Banana was rated best for appearance and texture with Butterfinger rating best for flavor and tenderness. Plans are underway to gather further results from the 2015 crop.
After the potatoes have been processed and analyzed portions of the harvest have been donated to the Great Plains Food Bank to be distributed throughout ND. Who says, “You can’t have your data and eat it too!”
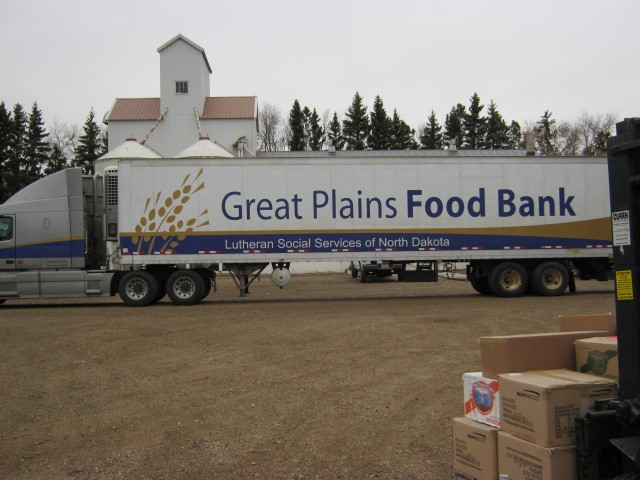
2013 crop being loaded into the semi-trailer.
Steve Zwinger
Research Specialist
Field Pea Relay Cover Crop
In recent years there has been a renewed interest in the use of cover crops as a means to achieve an array of benefits. The potential benefits are broad in scope and include the basic benefit of providing cover to prevent erosion along with building soil organic matter, maintaining soil biological activity, enhancing nutrient cycling, and numerous others benefits. One of the primary challenges of realizing these benefits is actually getting a cover crop established within a timeframe that allows the cover crop to do its job.
Here at the CREC we have used a non-traditional practice to achieve a cover crop. The cover crop practice we are using is promoting the growth of volunteer plants in a field pea field after harvest is complete. Harvest of field pea like many other crops results in some degree of harvest loss whether it be at the header or from seed thrown out the back of the combine. Generally peas are grown in regions of the state where no-till is the primary tillage practice. When tillage does not occur the pea seeds lost at harvest will either germinate on the surface and die or may only develop a weak plant. At the CREC, field pea has been an important crop among the rotations practiced for the production of foundation-grade seed. Conventional tillage is mostly used in our seedstocks program in part due to the need to foster volunteer seeds to ensure seed purity in later years of the rotation. We have found that when we lightly disk the peas soon after harvest, a high percentage of the seeds germinate and establish a vigorous plant. The resulting volunteer field pea plants often create a vibrant cover crop that has adequate time to develop and produce varied benefits since peas are typically harvested in late July to early August.
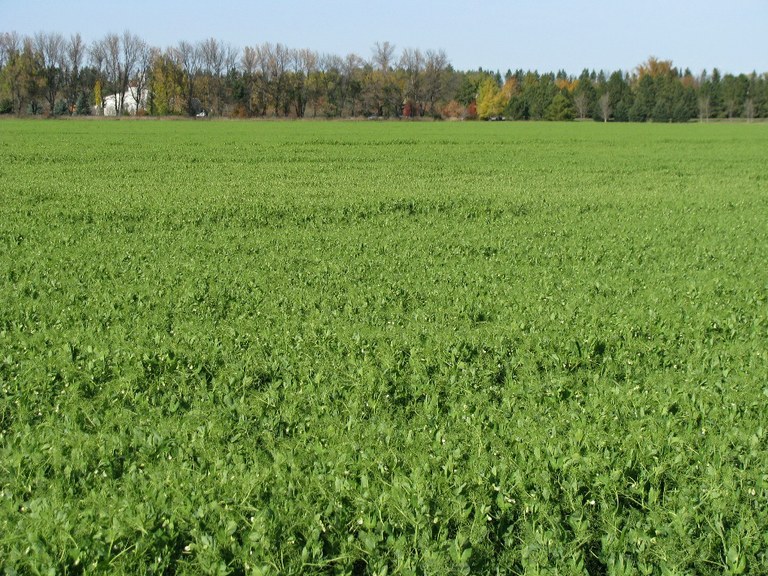
Pea relay cover crop, October 2010. (Notice trees in background.)
We call this approach a pea relay cover crop. Since the early 2000s the CREC’s seedstocks program has strived to perform a light tillage operation soon after pea harvest to promote the volunteer peas and the resulting cover crop. The overall volunteer pea stand density, above- ground biomass and nitrogen within that biomass have varied through the years. These variations have been primarily influenced by fall precipitation, seed harvest loss and the time for growth until temperatures consistently reach the mid-twenties. Generally we have documented that this cover crop has produced above-ground biomass yields of 1,752 lbs per acre dry matter with yields ranging from 912 to 2,231 lbs. Based on review of the nodules, the field pea plants would appear to be actively fixing nitrogen. Analysis of the nitrogen levels in the biomass collected would indicate an average nitrogen accumulation of 69 lbs per acre with levels ranging from 36 to 88 lbs of N.
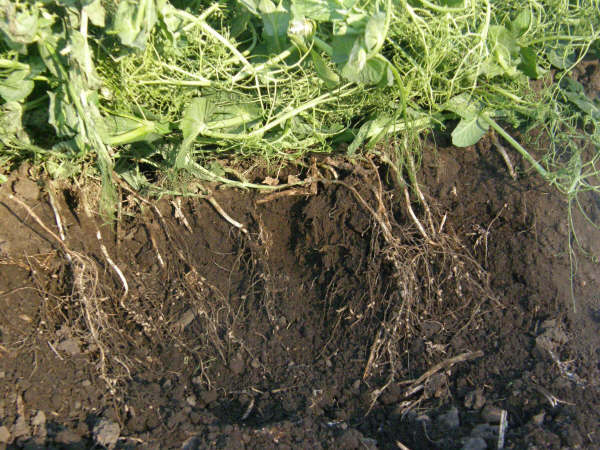
Nodulation of pea roots from volunteer plants of pea relay cover crop.
By implementing some limited practices (e.g. timely light tillage), fields at the CREC that have produced a foundation-grade of seed have also resulted in production of additional organic matter, some level of additional biologically-fixed N and maintained soil biological activity throughout the growing season.
Blaine Schatz
CREC Director and Agronomist
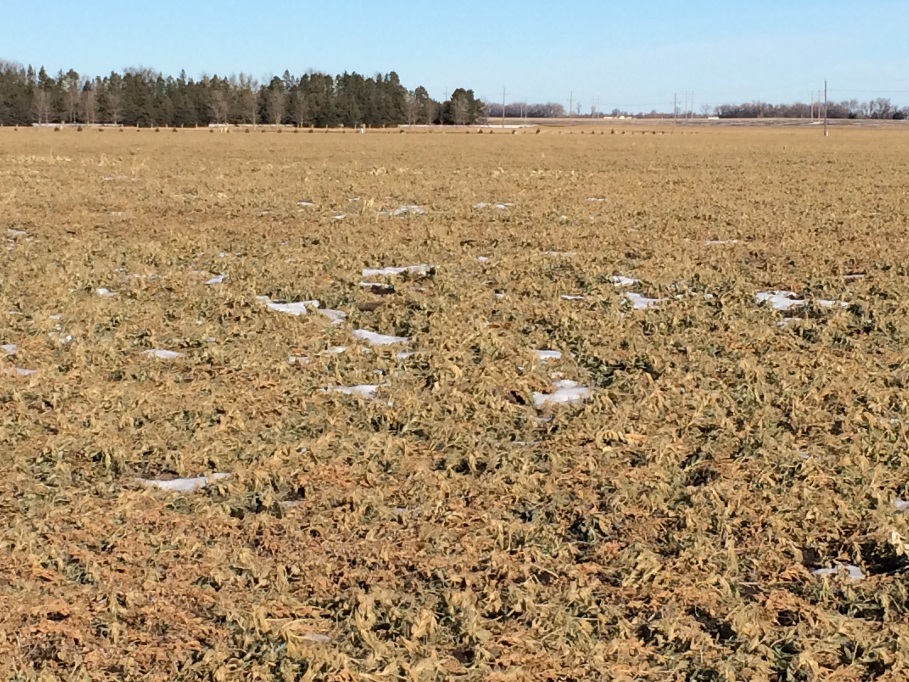
Pea relay cover crop at CREC on December 7, 2015.
Central Dakota Ag Day at CREC on December 17
The second annual Central Dakota Ag Day will be conducted on Thursday, December 17 at the NDSU Carrington Research Extension Center (CREC). Thirty-one half-hour concurrent sessions will be offered in agronomy, ag economics, animal science and horticulture. In addition, event participants can attend an hour general session titled ‘Climate change/ND weather forecast’.
As examples of concurrent session offerings, the following are agronomy topics to be presented:
- Will S (sulfur) make $?
- Summary of corn emergence and yield study
- Alternative specialty oil and legume crop production updates
- Conventional vs. Roundup Ready soybean
- Soil salinity management
- Vegetative options for saline soils
- Rainfall simulator demonstration
- Live weed identification
- Herbicide-resistant weed management
- Herbicide spray adjuvants
- Sprayer cleanout and temperature inversion effects on sprayer drift
The event begins with coffee and doughnuts at 9:30 a.m. Educational sessions start at 10 a.m. Lunch will be provided. Ag industry booths also will be available for viewing. Continuing education credits will be available for CCAs.
Central Dakota Ag Day is sponsored by the NDSU Extension Service and Agricultural Improvement Associations in Foster, Eddy, Wells, Griggs, Sheridan and Stutsman counties.
For program details, look in the ‘Events’ section of the CREC homepage: www.ag.ndsu.edu/CarringtonREC/ or contact the county Extension offices or CREC.
Greg Endres
Area Extension Agronomist
Kids and Compost…From the Feedlot to the Garden
With over 500 permitted animal feeding operations in North Dakota, the potential fertilizer value from nutrients being produced by livestock is noteworthy.
The American consumer is three to four generations removed from agriculture, meaning the connection to where food comes from and how it is produced is limited and at times, unknown.
During the January 2015 event called Ag and YOUth held in Jamestown, the common response from youth when asked about livestock manure was “eww, gross” or “it smells bad”. The Kids and Compost program began to evolve as a way to make an agriculture connection with youth while demonstrating a nutrient cycle and showing them how an animal’s “waste” product is useful.
Grant funds were obtained in 2015 from the North Dakota Junior Master Gardener (JMG) program to build compost tumblers for use in Extension programs. Compost tumblers were assembled for Emmons and Stutsman counties. The project, Kids and Compost, became part of a larger program in each county during the summer. A whole farm nutrient cycle program was created including:
- Feedlot manure and other appropriate materials being turned into compost in a tumbler.
- Engaging presentation aids and hands-on activities where students learned what manure feels like, smells like, what nutrients it contains, and how manure and compost are used as a fertilizer source or soil amendment.
- The opportunity to participate in a group project making compost in a small tote.
- Each student grew their own wheat to take home using compost to show the full cycle of livestock creating nutrients that can be used to produce human food.
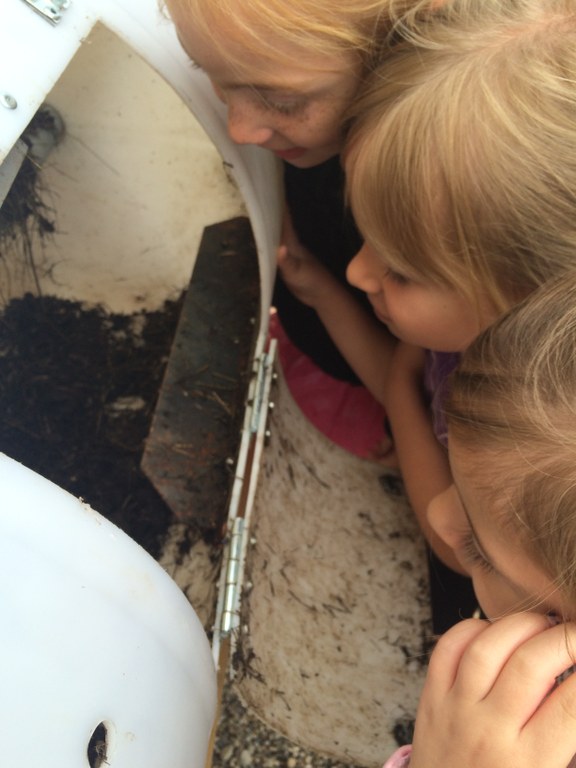
Youth viewing compost that was made in a tumbler during the Stutsman County project. A special thank you to Wholesale Ag Products in Carrington for donating the new plastic barrels that were used to make the body of the tumbler.
A total of 100 students from first through sixth grade participated in the Kids and Compost lesson in two counties during the summer of 2015.
Based on post-participation surveys of the students:
Emmons County
- 100% gained above average or a lot of knowledge on how compost is made.
- 83% said they had above average or a lot of knowledge of what materials can be composted.
- 92% said they had above average or a lot of knowledge of what nutrients are in compost.
Stutsman County
- 92% correctly answered the question: “What materials can be composted?”
- 19% answered “composting” when asked one thing they learned during the summer-long JMG program.

This is some feedback received from the program:
- One student intended to: “Teach my mom how to compost.”
- “They became aware not everything comes from a store. You can grow it!” – Guardian
- “They had a lot of questions where each food comes from.” – Guardian
(Above) A growing wheat head. A special thank you to Coke in Bismarck for donating the bottle planters and cap noses for this project.
Mary Berg
Area Extension Specialist
Livestock Environmental Management
Purchasing Foundation Seed

The month of November is a certain indication that winter is not far away. Spring, summer and fall have flown by.
An early spring for crop planting, a nice summer for grain growth and a long fall for harvest has allowed most of the crops to be taken off. Fall field tillage has been happening at a rapid pace; perhaps this is an indication of a more traditional mindset toward a variety of crops being planted next spring. Crop diversification in a rotation spreads out the workload, helps with disease issues and can benefit soil health.
The NDSU Foundation Seedstocks Program has important deadlines for purchasing Foundation seed from the Research Centers for next spring. Total foundation seed inventory available for distribution is in excess of 50 varieties of spring wheat, winter wheat, durum wheat, barley, flax, dry bean, soybean, oat, rye, safflower, lentil, buckwheat, crambe, chickpea, and field pea.
An order from an established Certified grower, placed by February 28 of the current year (2015) for delivery of the following year (2016), accompanied by a 25% deposit, received first priority for any available seed. That deadline has passed for the 2016 planting season.
Second priority will be orders from Certified growers placed by December 1. Orders are typically placed via a phone call to one of these Production, Conditioning & Seed Distribution locations:
- Agronomy Seed Farm, Casselton. 701-347-4743.
- Carrington Research Extension Center. 701-652-2951.
- Langdon Research Extension Center. 701-256-2582.
- North Central Research Extension Center, Minot. 701-857-7679.
- Williston Research Extension Center. 701-774-4315.
Confirmations and invoices are sent to each producer.
Orders placed after December 1 will be filled on a first-come, first-served basis.
Allocations will not exceed 10% of the total supply of a variety. Growers who purchase Foundation seed are encouraged to request field inspections so that seed production can be sold as Registered or Certified seed.
Dave Copenhaver
Seedstocks Research Specialist
Cattle Feed – Does It Pass the Test?
For years, colleges have recommended testing feed for nutritional value. The minimum feed tests that should be done for a cow herd are dry matter, crude protein, and energy (as measured by acid detergent fiber). We can also test for macro minerals: calcium, phosphorous, potassium, magnesium and sulfur but that’s an additional cost. For even more expense, we can test for micro minerals which include copper, zinc, selenium, and others.
While a good nutritionist considers all nutrients required for a beef cow or calves, a few specific tests influence the most expense for feeding cattle. These five tests include what cattle need for energy, protein, calcium and phosphorous and the amount of moisture in the feed. A well balanced mineral mix can help supply the remaining nutritional needs.
Energy is needed to provide heat, muscle contraction, and growth in all animals. A laboratory feed test cannot directly measure energy, so we determine acid detergent fiber (ADF) in the feed and calculate the energy content.
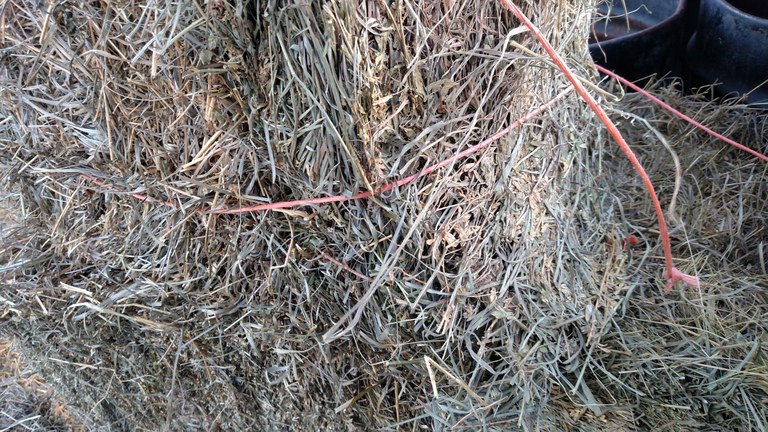
This year, most grass hays have been testing low in energy. Grass hay should have 52-56 % TDN (energy). Some hays are testing at 40-45% TDN. These hays need supplemental energy or cattle will lose weight during the winter.
Also, if alfalfa hay has been rained on after cutting hay and before baling, it has lost energy content. The rain has washed part of the nutrients out of the hay.
Protein content of feeds should be tested. Surprising, this year’s fed stuffs mostly have adequate protein content. A cow needs a ration with 7-9 % crude protein and calves need 11-13% crude protein rations.
Co-products like beet pulp or beet tailings contain a high percentage of water. A dry matter test will determine how much dry feed is in a ton of feed. Pressed beet pulp should have 30% dry matter. Wet pulp (not pressed) may have only 15% dry matter (85% water). Consequently, wet pulp would need to be fed double (2 times) on an ‘as fed’ basis as compared to pressed pulp to get the same dry matter and energy content (60 pounds wet equals 30 pounds pressed).
Dry matter, energy, and protein can vary drastically among feeds. Knowing the actual value will help manage feed costs in cattle through avoiding feeding too little or too much. For specific questions on cattle nutrition or how to take a feed sample and where to send it, contact the Carrington Research Extension Center or your local Extension agent.
Selected feeds tested Fall 2015:
Karl Hoppe
Area Extension Specialist / Livestock
Impact of Plant Establishment on Corn Production in Eddy, Foster and Wells Counties, 2013-15
North Dakota State University conducted a statewide study in 2013-14, and continued in 2015 in a three-county area, to evaluate the impact of corn plant establishment on grain yield and quality. The study’s main objective was to measure the yield response of late-emerging plants, plant doubles and plant skips compared to normally emerged and evenly spaced plants. This report will summarize highlights of the study conducted in Eddy, Foster and Wells counties using data from 10 commercial fields.
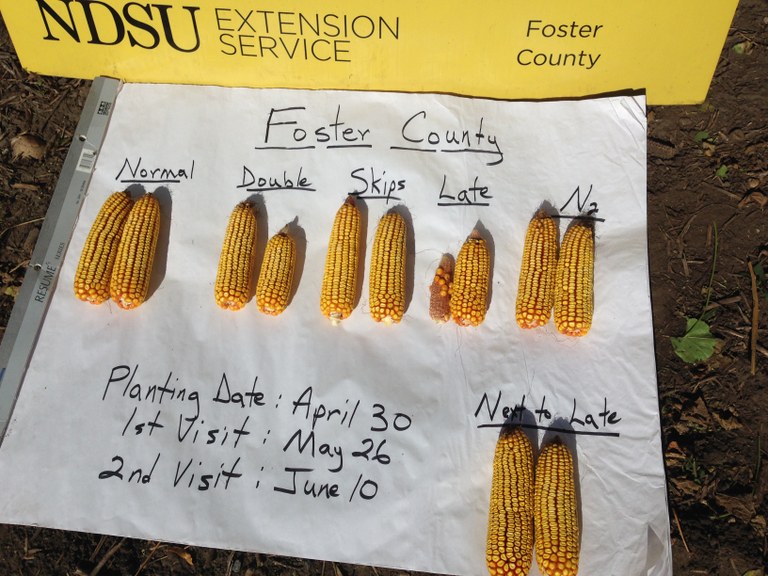
Three plots (replications) were located within each field and consisted of 12 or 16 rows with a length of 30 feet. Plant populations were measured at emergence and about 7 and/or 14 days after the initial emergence date. Plants emerging after general field emergence time were identified, as well as plant skips (plants with distance greater than 12 inches of one another within row) and plant doubles (plants within 2 inches of one another). At maturity, corn ears were hand harvested and grain mechanically threshed to determine seed yield, moisture and test weight.
Results
The table summarizes harvest data during 2013-15 among the 10 corn fields. Each field contained plants that emerged at least one week after general plant emergence.
- Ear weight of these late-emerging plants was 7 to 100% less and averaged 49% less compared to ear weight of timely emerged plants.
- Ear weight from plant skips ranged from 13% greater to 11% less, and averaged 1% less than uniformly spaced plants.
- Plant doubles had ear weight 3 to 56% less and averaged 19% less than ear weight of uniformly spaced plants.
Takeaway
The study confirms that using corn planting techniques that provide timely field plant emergence is important to optimizing grain yield and quality. Uniform plant spacing within rows also aids in maintaining yield potential but variability of plant spacing has less negative impact compared to late-emerging plants.
Greg Endres
Extension Area Agronomist
Other team members include: Tim Becker, Joel Lemer, Lindsay Maddock and Lindsey Novak
Effects of Corn or barley with low or medium fat dry distillers grain with corn silage in growing and finishing steers diets.
Objective: Investigate the effects of oil removal from distillers when fed with corn or barley on growing and finishing performance of steers.
Research has established that the distillers grain (DDG) by product that results from ethanol production is an excellent livestock feed resource particularly for feedlot cattle. However, as the ethanol industry continues to develop and advance so does technology within the ethanol industry. The use of centrifuge technology to spin off a portion of the corn oil has resulted in DDG with lower oil content. The resulting DDG has changed from originally having about 12% crude fat to a medium fat level between 8-10%. Additionally, some ethanol plants also use a fractionation technology that allows them to lower the fat content of the resulting DDG to around 5%. Fat is considered an energy source in feedlot diets. With the reduction in the fat content of current DDG, the industry needs to know how this has affected the feeding value of DDG and how the new medium and low fat DDG feedstuffs interact with other feedstuffs that may be fed.
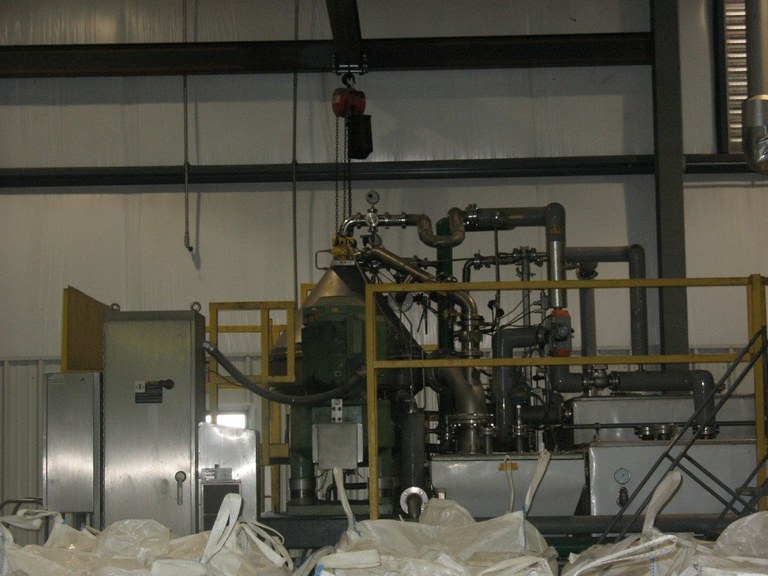
Centrifuge that removes fat during ethanol production.
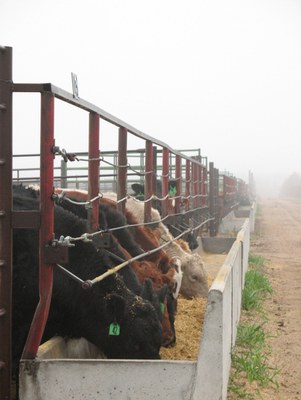
We recently completed a feedlot growing (57 days on feed) and finishing study (133 days on feed) to evaluate two fat levels of dry corn distillers grains (DDGS; 5.8% and 9.6% fat) with diets containing corn or barley and corn silage. The primary objective of the study was to investigate the effects of oil removal from distillers when fed with corn or barley on growing and finishing performance of steers.
One hundred and fifty-four head of weaned crossbred feeder calves (685 pounds initial body weight) were used to evaluate the effects of feeding medium (9.6%) or Low (5.8%) fat DDGS with corn or barley grain. Steers were blocked by initial body weight and randomly assigned to one of 16 pens (9-10 animals/pen) at the NDSU Carrington Research Extension Center Livestock Unit. Each pen within a block was randomly assigned to one of 4 treatment diets: 1) Corn with medium fat DDGS; 2) Corn with low fat DDGS; 3) Barley with medium fat DDGS; 4) Barley with low fat DDGS (Table 1 and 2). The first 57 days on feed the cattle were fed a backgrounding ration, then for the remaining 133 days on feed they were fed a finishing ration. Cattle were marketed to a commercial packing plant and carcass data was collected on all animals.
Results: For both the growing and finishing periods there were no statistical interactions for grain source (corn or barley) and DDGS type (medium or low fat). Therefore, all data is presented as the main effects of corn vs. barley and medium fat vs. low fat DDGS. There were no statistical differences between DDGS type for live animal performance parameters for live weight, average daily gain (ADG), dry matter intake (DMI), or gain to feed for both the growing and finishing phases (Table 3). Corn and barley diets resulted in similar live weights and similar average daily gain for both the growing and finishing periods. However with the exception of DMI for the growing phase, DMI for corn was greater than barley diets for the finishing period and overall for the whole 190 days on feed. With similar average daily gains for these periods for corn and barley, this also resulted in barley diets having greater overall gain to feed for the 190 days on feed. Carcass characteristics were similar for both DDGS diets and the corn and barley diets (Table 4).
Implications: Barley grain showed improved feed efficiency over corn grain. Low fat and medium fat DDGS fed at 25% of the diet dry matter in diets with corn and barley resulted in similar animal and carcass performance for growing and finishing steers.
We have observed similar results in a previous research trial evaluating full fat (12%), medium fat (9%) and low fat (5%) DDGS in corn based finishing diets. In that work, while full fat had greater marbling scores than medium and low fat DDGS fed cattle, all other live and carcass performance parameters were similar for each fat level of DDGS.
Acknowledgements: Thank you to the North Dakota Corn Council for project funding, the Dakota Feeder Calf Show Consignors for providing the cattle, and the CREC livestock Unit technical staff for their care and feeding of the cattle.
Chanda Engel
Livestock Research Specialist
Distillers Grains A Source of Phosphorus Fertilizer
We started a study in 2015 to assess the phosphorus fertilizer value of wet distiller’s grains (WDG) in the production of corn.
Distiller’s grains are nutrient-rich co-products, which include WDG's, condensed distiller’s solubles (CDS) and dry distiller’s solubles (DDS), from dry-mill ethanol production. They are used as feed ingredients for livestock diets. Besides their nutritive values, their elemental content can also be very useful as fertilizer sources.
The volume of distiller’s grains produced by ethanol plants in North Dakota (ND) often supersedes their demands by livestock owners. Thus ethanol producing plants have to deal with energy costs of drying WDGs (photo 1), which have a low shelf life for storage; or deal with the high cost of transportation to supply producers that are distant from the ethanol plant.
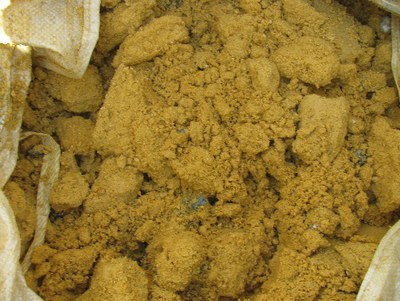
Photo 1.
Some ND farmers seeking ways to cut down on fertilizer input costs have been expressing interest in WDGs as a source of fertilizer. These interests prompted a study to test WDGs as a phosphorus source for corn, along with CDS (photo 2) also called syrup, and triple superphosphate (TSP) at three levels of phosphorus. All inputs were incorporated after application at 0, 40, 80, and 120 lbs P2O5/ac. The WDG analysis on wet basis (72%) contained 18 lbs/T P2O5, 24 lbs/T total N, 7.2 lbs/T S. CDS contained 103 lbs/T P2O5, 164 lbs/T total N, and 36 lbs/T S.
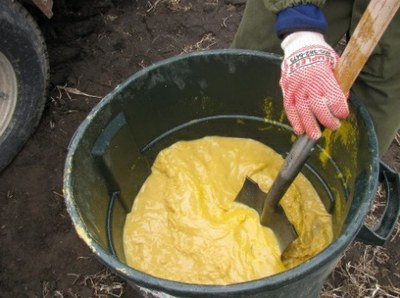
Photo 2.
Results:
-
Corn grain yields increased with application of distiller’s grains.
-
CDS produced the highest yields followed by WDG’s and TSP.
-
Protein data are awaited and more details will be reported in the 2015 CREC Annual Reports.
-
Study will continue next year to confirm results. Practical applications will also be tested.
Jasper Teboh
Soil Scientist


