

2017
Merry Chistmas and Happy New Year
To the tune of “I’m Dreaming of a White Christmas”.
I’m dreaming of a greener summer,
Not like the ones we’ve had before
Where the trees are yielding
And producers willing to hear the research that we shared.
I’m dreaming of a warm feedlot
With every Center Points we write.
May your fields have no fusarium head blight
And may all your Christmases be white.

Season’s Greetings from all us at the CREC. May you have a Merry Christmas and a prosperous 2018.
Flying a Drone During Cold Weather
Just as a reminder, those who wish to fly a drone for business purposes are required to comply with the FAA small UAS rule (14 CFR part 107) and to obtain a Remote Pilot Certificate. You can find more information about becoming a certified remote pilot here https://www.faa.gov/uas/getting_started/fly_for_work_business/becoming_a_pilot/.
For ranchers who own a drone, as the weather gets colder and colder, it sounds like a very good idea to fly your drone over the yard or pasture to check on the cattle. Drone makers in general have a recommended temperature range for operation. For example, the operating temperature range for both DJI Phantom 4 and DJI Mavic drone series is between 32oF and 104oF. So, if you are flying at temperatures below 32, you are flying at your own risk. Know that cold temperatures increase the risk of something going wrong with your drone and it is very unlikely that the drone maker will cover any damage resulting from flights carried out under unsuitable conditions.
One thing to keep in mind when flying under cold conditions is that your flight time will be shorter than normal due to the effects of low temperature on the lithium-polymer (LiPo) batteries. Cold weather temperatures slow down the chemical reactions in LiPo batteries, which lowers their capacity. Under those conditions, typical flight time (20-25 minutes) may be shortened to 10-15 minutes.
Low temperatures can cause sudden large drops in power levels, which can compromise your ability to bring the drone back “home”, and in extreme cases it can cause the drone to crash. Low temperatures can also impact the performance of the drone’s sensors, which can cause it to drift and to be less responsive to the pilot’s control inputs. This may be a big issue when flying closer to obstacles, such as buildings and trees, and can result in a crash due to poor control of the drone. In addition, adverse temperature condition might make very hard for one to keep steady control of a drone.
If you feel like flying your drone during the coming months, I would encourage you to take a look on some tips provided in this link https://www.autelrobotics.com/blog/flying-drones-in-cold-weather-3-tips-to-do-it-right/ and on this video https://youtu.be/Chcv8ESb60I?t=40. The tips provided may improve your chances of having a successful flight under cold conditions.
As always, please keep safety as a top priority when flying. Drone crashes happen all the time. Flying at low temperature weather will increase the odds of one of those happening to you. Remember that flying a drone below drone maker recommended temperatures means that you are flying at your own risk, and it is unlikely that the company will cover any damage resulting from such flight. Be safe out there!!!
 Photos captured around the Carrington REC headquarters. DJI Phantom 4 Pro. Date 11/12/2017.
Paulo Flores
Paulo.Flores@ndsu.edu
Precision Ag Specialist
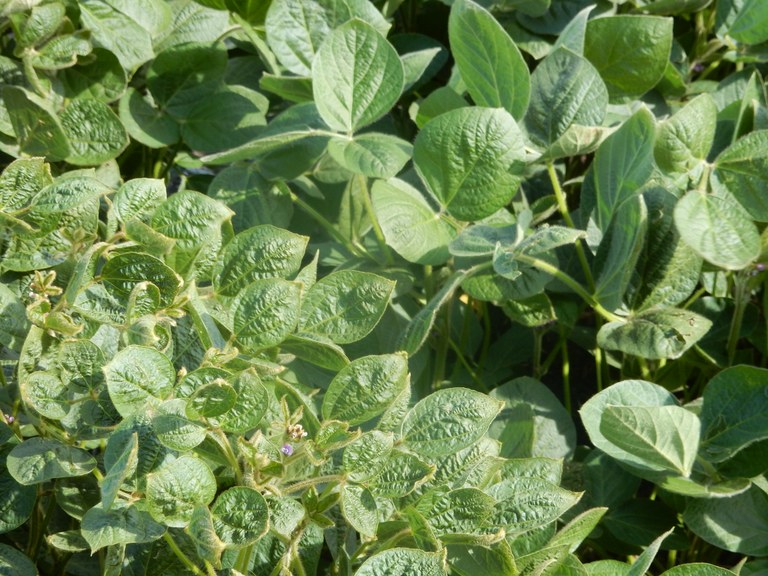
Soybean Dicamba Tolerance Across Varieties
This past summer, PGR (plant growth regulator) symptoms showed up in many soybean fields. In many cases, dicamba drift was the likely cause of the PGR symptoms being expressed. While some instances of drift injury were clear, with severe stunting, delayed maturity, and reduced yields, many instances were less severe with leaf cupping, alligator skin, but no growing point damage. The difficult task this winter will be for many people to determine if there was any yield damage due to the less severe symptoms. One of the confounding factors is the observed differences in symptoms between soybean varieties. At the CREC, we rated the severity of PGR symptoms for varieties in our soybean variety trials. The varieties were given a score of 0-9 based on symptom severity. A 0 indicated a perfectly healthy plant, while a 9 indicated severe growing point damage and stunting. At Carrington symptoms were relatively light in most cases with only a handful of plots reaching a score of 5. At a 5, there was severe leaf cupping, along with some leaf necrosis along the edges, but no growing point damage
In each trial, there were several plots and varieties with no symptoms. The highest percent of PGR-affected plots was in the Liberty Link trial, where 83% of plots displayed symptoms, compared to the low of 66% of plots in the conventional trial. Roughly half of all plots which had symptoms were categorized as having only minor leaf cupping (a score of 1).
Two Liberty Link soybean varieties with different levels of PGR symptoms.
It is difficult to estimate the effects of symptoms on soybean yields by only looking at a single year. In Figure 1, it appears that yield is gradually increasing as the severity of symptoms increases. This initially indicates that the expression of symptoms has caused a yield increase. However, a more accurate method to test the effects of symptoms would be to compare 2017 to historical data. There were several varieties tested in both 2016 and 2017 at Carrington. For each year we determined if the yield increased or decreased compared to the average. This was plotted against symptom severity in 2017 (Figure 2). With this comparison, there was no relationship between symptom severity and change in yield. Statistically, this indicates that varieties with more symptoms did not perform different than varieties without symptoms. In Figure 1, yields seems to increase with symptom severity, but this could be linked to inherent production potential. Varieties that were more affected by PGR symptoms may have been varieties that were growing more vigorously at the time of symptom expression, thus more prone to any factor causing a PGR response. Essentially, dicamba exposure was not increasing yields but rather varieties with higher yield potential were more susceptible to the effects of dicamba and the level of injury was not enough to decrease yield.
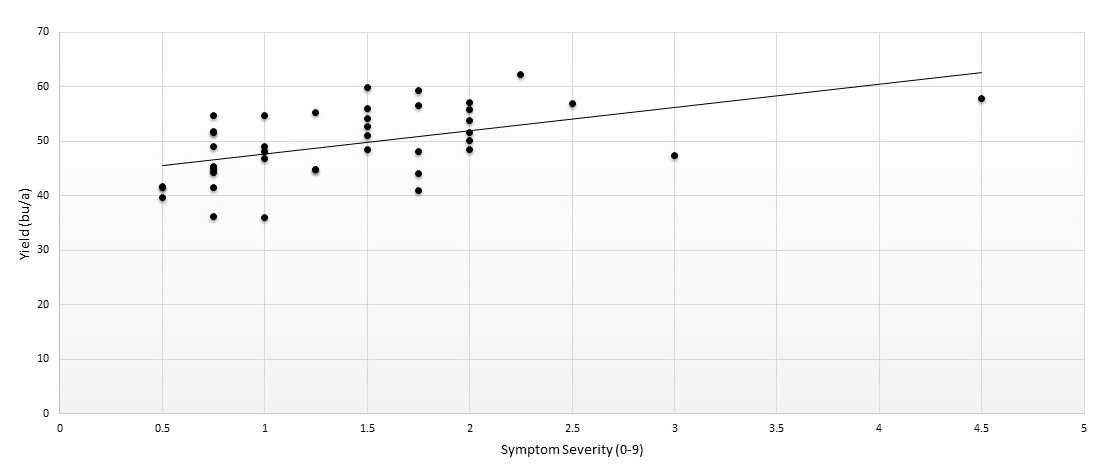
Figure 1. Soybean variety performance compared to plant growth regulator (PGR) syptom severity.
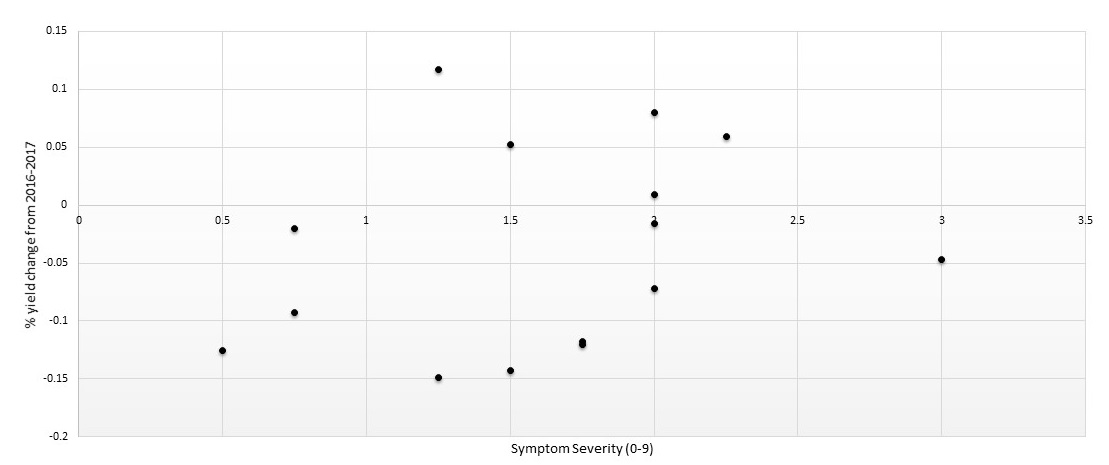
Figure 2. Year to year change in variety performance based on PGR symptom expression.
If dicamba symptoms were more severe, such as plants with growing point injury and/or stunted growth, yields would surely decline. Even though varieties in our trials differed in the expression of PGR symptoms, with only leaf cupping and blistering, there did not appear to be any consistent positive or negative yield response based on variety.
Mike Ostlie, Ph. D.
mike.ostlie@ndsu.edu
Research Agronomist
Phosphorus Effect on Yield of Soybean Planted at Different Dates
Is planting date an important factor to consider when phosphorus (P) is applied to soybean?
Early planting of soybean in spring comes with frost risk, especially if planted too early when the soil temperature is <50°F. Phosphorus availability is low at this temperature. One study showed that plant P uptake at 60°F can be two to three times less than at 70°F.
The impact of P on soybean yield is not consistent. Crops sometimes overcome early P deficiency when the soil warms up later in spring and improves root uptake.
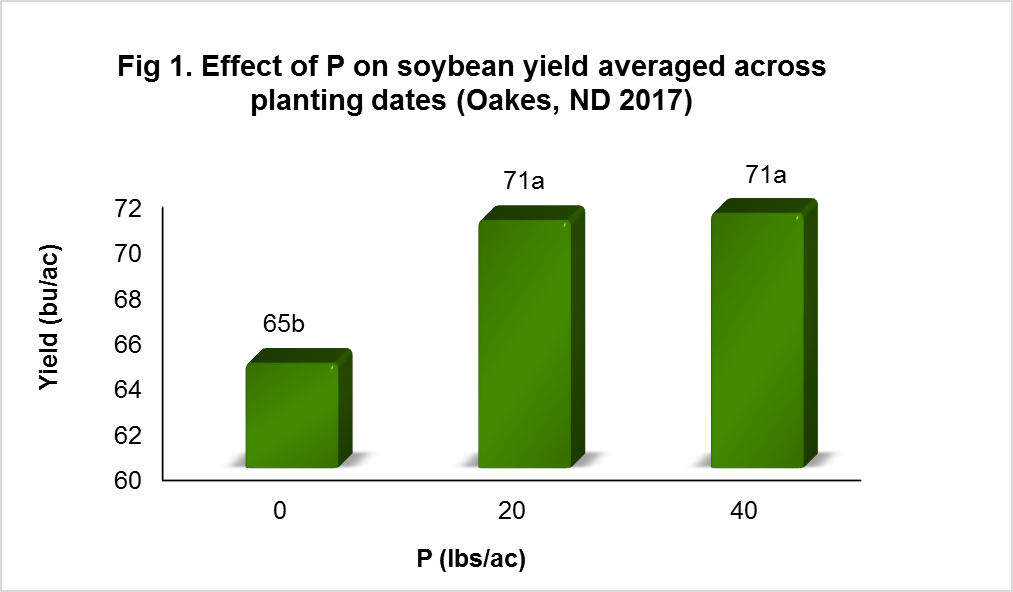
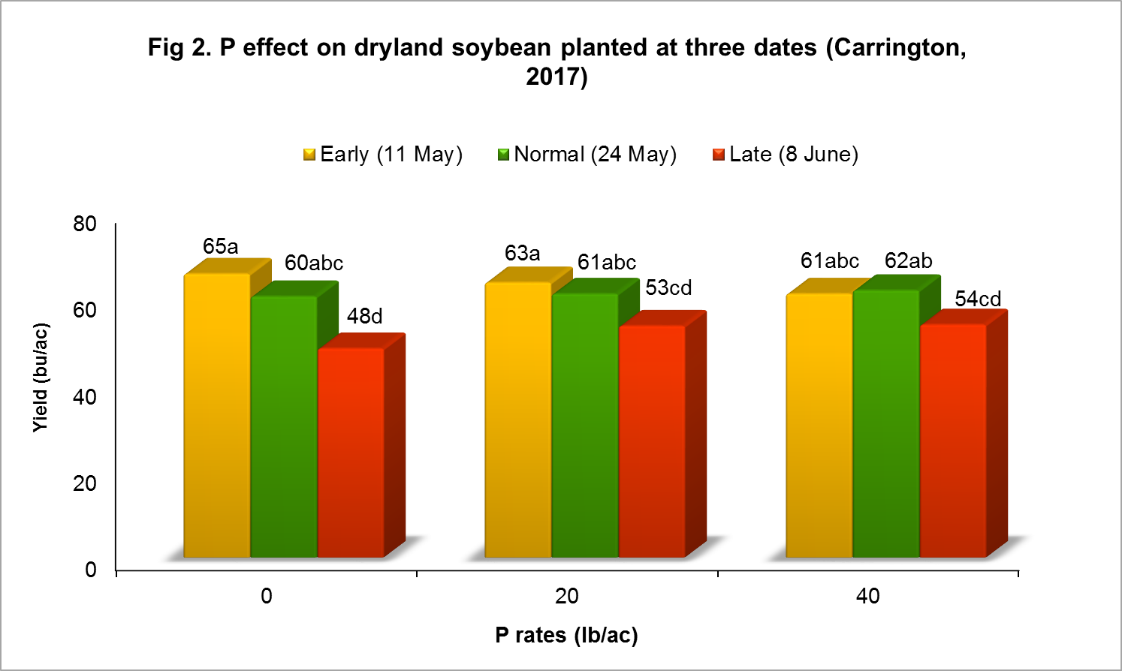
In 2017, a trial was set up at two locations to assess the effect of P rates at 20 and 40 lbs/ac plus a check (0 lbs P) on yield of soybean planted early, during normal planting at Oakes (two dates, irrigated), and late planting at Carrington (three dates, dryland).
Results
At Oakes (Irrigated soybeans, soil P test = high)
- P had significant effect on yields, resulting in 5-bushels increase (Figure 1) at either 20 or 40 lbs P
- Planting date had no significant influence on how soybean responded to P.
- Yields from early planting (71 bu/ac) were significantly greater than planting two weeks later (67 bu/ac).
At Carrington (Dryland, soil P test = 7 ppm)
- There was a planting date and P fertility treatment interaction effect. This means that the effect that P had on soybean yields varied by planting date (Figure 2).
- Yield loss from not planting early, as shown in Figure 2, was greater without P application than when P was applied. For example, at the check (0 lb P), yield loss was 5 bushels at normal planting on May 24, and 17 bushels when planting was late (June 8) compared to early planting.
- At the 20 lbs P level, yield loss was 2 bushels at normal planting, and 10 bushels at late planting when compared to early planting.
Conclusion
Early planted soybean (before May 17th) or normal planting (around May 17 to 24) will likely produce greater yields than planting anytime in June. Considering these results and other planting date studies in 2017 at Carrington, early planted soybean produced, on average, two bushels more than at normal planting date. Yields from the early planted late variety, MG-0.8, were better than when planted later. A major advantage for early planting, especially a later maturing variety at Carrington, is the longer growing time that allows crops to accumulate dry matter.
A summary of other soybean planting results by CREC researchers can be accessed at: https://www.ag.ndsu.edu/CarringtonREC/center-points/soybean-planting-date
Jasper M Teboh, Ph. D.
Jasper.Teboh@ndsu.edu
Research Soil Scientist
Acknowledgement: Thank you to the North Dakota Soybean Council for funding this research.
Are You Giving Credit Where Credit is Due? Thoughts on nutrient management planning.
In between trying to get corn off the field and hoping the snow waits just a little longer, you are also supposed to be thinking about a field plan for next year. What will you plant, what herbicides you will need and what fertilizers will you use? Did you spread manure on your fields? If you did, does that manure have a fertilizer value and are you considering that when you make your fertility plans?
The total nitrogen (N) in solid beef manure is 50% available to plants during the first growing season. That means if the manure you used has 13 pounds of total N/ton of manure (ND beef manure average), 6.5 pounds of that is available for plant growth. Given you spread 25 tons of manure/acre you have 325 pounds of total N with 162.5 pounds of that available during the first growing season. What happens to the other 162.5 pounds? In year 2, 20 percent of the total N, or in this example, 65 pounds of N would be available during the second growing season. Are you taking that credit into consideration as you map out your nutrient management plan for the next growing season?
Let’s say you plan to plant corn grain in eastern North Dakota in medium-textured soils with historic yields greater than 160 bu/ac. You have a previous crop (soybean) credit and you have 20 pounds N/ac in your soil. (You know all of this because you tested your soils and you used the ND Corn Nitrogen Calculator.) The N recommendation for your yield goals would be 162 pounds/ac.
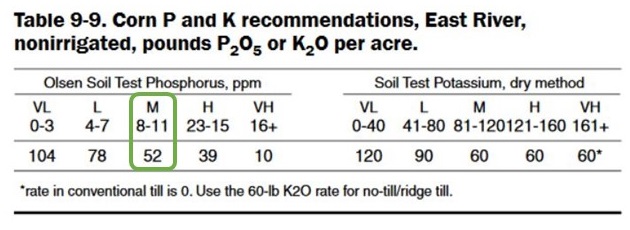
According to this example, in year 1, you wouldn’t need to add any other nitrogen fertilizer to reach your yield goals. Looking at phosphorus (P), if you have 6 pounds of P/ton of manure (ND beef manure average) and you’re spreading at 20 ton/ac you have 120 pounds of total P. Eighty percent of the total P in solid beef manure is available for plant growth during the first growing season, so 96 pounds of P/ac would be available. If your soils are in the medium range (8-11 ppm) according to the Olsen test, you would need 52 pounds of P/ac. So your N and P requirements are already met.
From SF-882 - North Dakota Fertilizer Recommendation Tables and Equations
Let’s move on to year 2. You’re going to plant soybean in the field described above following the corn crop. You have no previous crop credit. Your soil test says you have 15 pounds of N and you know from above that you have 65 pounds of N from manure. So you have 80 pounds of N fertilizer right off the top. According to the North Dakota Fertilizer Recommendation Tables and Equations, you will need zero pounds of N fertilizer for a 60 bu/ac yield potential. Ten percent of the total P in manure is available in year two for plant use. The P credit from the manure would be 12 pounds/ac. Because of the excess P that was applied during year 1, your soil test P will very likely be in the high to very high range, neither of which require additional P fertilizer.
Often times in the Midwest, producers aren’t instructed to give manure fertilizer credit value but we have to remember that along with the added organic matter and beneficial organisms, we are also adding useful nutrients when manure is spread on a field. Let’s give credit where credit is due.
Additional resources:
- Find a North Dakota custom manure hauler: https://www.ag.ndsu.edu/lem
- Regional Manure and Soil Health Blog: http://soilhealthnexus.org/blog/
- e-Xtension Animal Manure Management: http://articles.extension.org/pages/8647/manure-nutrient-management
Mary Berg
Mary.Berg@ndsu.edu
Area Extension Specialist
Livestock Environmental Management
Black Bean Seed Yield with Row Spacing and Plant Population
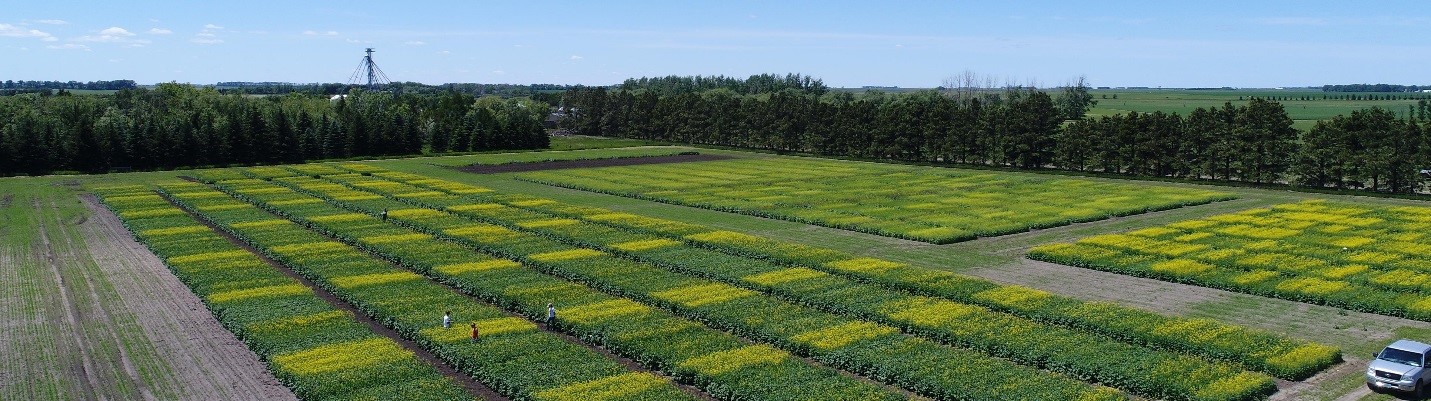
A field study, partially funded by Northarvest Bean Growers Association, is being conducted to examine the response of black bean to row spacing and plant population. ‘Eclipse’ was planted in 14-, 21- and 28-inch rows at 100,000, 125,000 and 150,000 pure live seeds (PLS)/acre at Carrington in 2014 and 2016-17. In addition, ‘Eclipse’ was planted at the three rates at Park River in 2014, and Prosper in 2014 and 2016-17.
Averaged across three years and plant populations at Carrington, 21-inch rows increased black bean seed yield by 240 lb/acre compared to 28-inch rows (Table 1). Yield with 14-inch rows was statistically similar to 21-inch rows.
| Table 1. Black bean seed yield with row spacing1, Carrington, 2014 and 2016-17. | ||||
| Row spacing | Seed yield (lb/acre) | |||
| Inches | 2007 | 2016 | 2017 | 3-year average |
| 14 | 1945 | 2356 | 2078 | 2126ab |
| 21 | 1860 | 3162 | 1988 | 2337a |
| 28 | 1595 | 2618 | 2074 | 2096b |
| LSD (0.10) | 210 | |||
| 1Variety='Eclipse'. Averaged across three plant populations. | ||||
Averaged across seven site-years and rows spacings, black bean planted at the low, medium and high rates produced 99,950, 118,530 and 140,480 plants/acre, respectively. Seed yield increased with the high- versus low-plant population, while the intermediate plant population was statistically similar to the high plant population (Table 2). Based on these data, return-on-investment would indicate that the intermediate planting rate would be appropriate.
| Table 2. Black bean response to plant population, North Dakota, 2014, 2016-17 (7 site-years)1. | ||
| Planting rate | Plant population | Seed yield |
| PLS/acre (x1000) | number/acre | lb/acre |
| 100 | 99,950 | 2430b |
| 125 | 118,530 | 2470ab |
| 150 | 140,480 | 2510a |
| LSD (0.10) | x | 75 |
| 1Variety='Eclipse'. Trial locations: Carrington and Prosper (2014, 2016-17); Park River (2014). Averaged across three row spacings at Carrington. | ||
These preliminary data would suggest black bean planted in narrow rows and with a planting rate to achieve 115,000 to 125,000 plants/acre would optimize yield potential. The study will be continued in 2018 at Carrington to expand the database before plant establishment recommendations by NDSU are revised for black bean.

Greg Endres
Gregory.Endres@ndsu.edu
Area Extension Agronomist
Other contributors: Hans Kandel, and Mike Ostlie.
Indulge Us This Week
Several staff members have recently received well-deserved recognition and we’d like to brag for a moment.
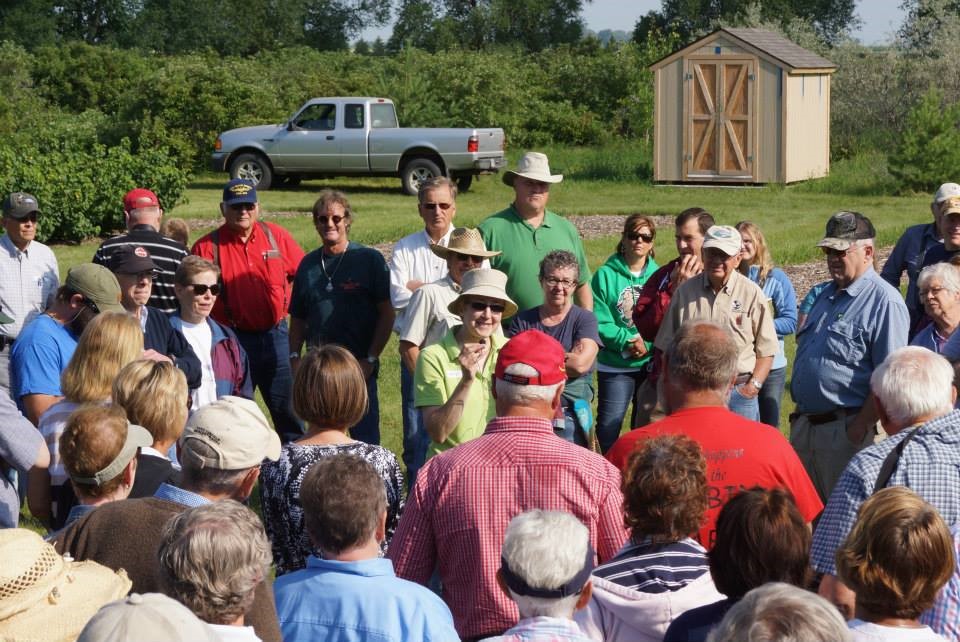
Each fall, NDSU Agriculture Experiment Station’s Research Extension Center staff, including scientists and specialists from the Carrington REC, our sister REC’s and all of the Extension agents and specialists across North Dakota, gather at Fall Conference. This multi-day conference provides sessions related to research updates, Extension program planning and professional development that helps set the path for the coming year. This conference also provides an opportunity to celebrate programming successes and service accomplishments. NDSU recognizes “milestone” years of service at five-year increments. At this year’s Fall Conference, NDSU recognized several CREC staff members who attained the following milestones.
5 Years
- Mary Berg (Extension Livestock Environmental Management)
- Billy Kraft (Plant Pathology)
- Mike Ostlie (Agronomy)
- Jasper Teboh (Soil Science)
15 Years
- Ezra Aberle (Agronomy)
- Richard Richter (Foundation Seedstocks)
- Timothy Schroeder (Livestock)
25 Years
- Leonard Besemann (Agronomy, Oakes Irrigation Research Site)
35 Years
- Steve Zwinger (Agronomy)
The Carrington REC has many long-time employees. In fact, over half of our staff have been full-time employees of NDSU for over 10 years, and a number were “summer crew” before that!

Blaine Schatz (left) awarding Mike Ostlie (right) with Years of Service certificate.
In addition to years of service milestones, programs and staff were recognized for excellence and impact on our constituencies. Among those recognized was the CREC’s Extension Agronomist, Greg Endres. Epsilon Sigma Phi, the Extension Service honorary organization, honored Greg for his support of and service to the NDSU Extension Service. He received the Visionary Leadership Award, presented annually to an Extension professional whose work has enabled Extension to anticipate emerging needs and develop support to implement relevant programs.
In recent months a couple of the national professional organizations that CREC staff participate in and contribute to have held their annual meetings. We are pleased to share with you the following awards and honors that CREC staff were recognized for.
NACAA
In July, Greg Endres and Mary Berg received honors at the National Association of County Agricultural Agents annual meeting at Salt Lake City, Utah in July. Information about the awards is included in this news release.
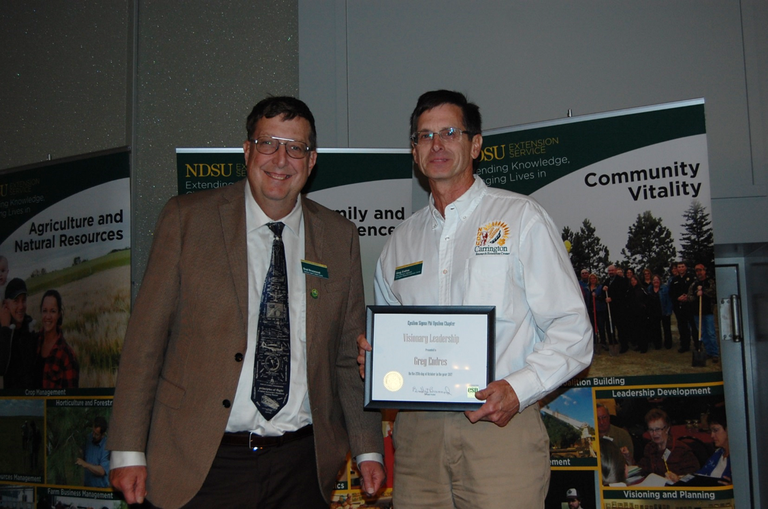
Greg Endres (right) receives the Visionary Leadership Award from Brad Brummond, an agent in NDSU Extension's Walsh County office and president of the Upsilon Chapter of Epsilon Sigma Phi. (NDSU photo)
Greg was a regional winner in the Publication category. His Extension publication, "Impact of Planting Dates on Dry Edible Bean," emphasizes that the traditional planting dates from late May to early June remain appropriate because early planting increases risk, while seed test weight increases at normal planting dates. NDSU Extension agronomist Hans Kandel co-authored this publication.
Mary received the National Achievement Award for outstanding educational efforts by a person with less than 10 years of experience with the Extension Service. Berg's Extension programming focuses on water quality improvement via livestock manure management.
Mary, along with several NDSU Extension collaborators, was also recognized for various state, regional and national finalist awards in the Website, Video Presentation, Fact Sheet, Learning Module and Search for Excellence categories.

Mary Berg, Todd Weinmann and Alicia Harstad receiving a national finalist award for the learning module communications awards category in Salt Lake City, Utah.
ASA
Greg Endres was part of a ten-person team that received the American Society of Agronomy’s 2017 Extension Education Community Educational Materials award for Field Guide to Sustainable Production of High-quality Durum Wheat in North Dakota. The annual international meeting of the American Society of Agronomy, Crop Science Society of America, and Soil Science Society of America was held in Tampa, Florida in October. This meeting was held at the same time as Fall Conference so Greg’s contributions at conference prevented him from attending the ASA in person.
The CREC has a very experienced staff of research and educational professionals who are dedicated to serving the mission of the CREC and of NDSU Agriculture. The information just shared is but an example of the recognition and accomplishments that others have bestowed upon our staff in years past.
Blaine Schatz
blaine.schatz@ndsu.edu
Director and Agronomist
Sick Calves? Don't wait to get a VFD.
It’s weaning time. Add weather changes that prelude to winter and the extra stress can lead to sick calves.
Cattle producers are well aware of the signs of a sick calf – depressed, not coming up to eat, not mingling with other cattle, droopy ears, snot hanging from their nose, and fever. These are the signs of calves that are visually sick. Since cattle and sheep are predated animals, they tend to hide the symptoms of being sick…until they are really sick.
That’s why the saying ‘a sick sheep is a dead sheep’ is somewhat true since by the time the sheep gives clear signs its sick (they hide it very well) – it’s very sick and recovery is not likely.
Cattle are more likely to show that they are sick, giving the caretaker time to individually help that animal. Generally, after a fever is confirmed with a rectal thermometer, sick calves are provided an injectable antibiotic and a pain reliever for individual therapy.
From a feed yard perspective, calves usually get sick a few days to a few weeks after arrival. Newly weaned calves, calves co-mingled with non-herdmates, and calves hauled and shipped for several days have extra stress. Add in a winter storm and the potential for sick calves increases drastically.
Calves that show symptoms of being sick need immediate medical assistance. However, the calves that are hiding symptoms have already been exposed to a likelihood of sickness, and under stressful condition such as a cold weather storm, may become sick. In this case, treating all of the calves in the pen might be indicated.
Mass treatment of cattle with antibiotics is referred to as ‘metaphylaxis treatment’. This can be accomplished by either injecting each calf with an antibiotic or putting an antibiotic in the feed.
Feeding antibiotic works well when calves – that are at high risk of getting sick – are still eating. Once a calf shows symptoms, the calf isn’t eating much and will not consume enough antibiotic.
Rules Have Changed
To purchase an antibiotic to be added to the feed requires a VFD – Veterinary Feed Directive. The VFD has to be written by a veterinarian. The VFD needs to be written, emailed, or faxed to the feed supplier before the cattle caretaker can purchase the feed antibiotic.
Cattle producers need to visit with their veterinarian BEFORE they can purchase a feed antibiotic. Just running to town to get some ‘CTC’, ‘oxytet’ or sulfa for the calves isn’t an option anymore. Plan ahead and discuss treatment approaches with your veterinarian and get a ‘VFD’.
More information on the VFD an be found here: https://www.ag.ndsu.edu/publications/livestock/understanding-the-veterinary-feed-directive/v1719.pdf

Which calf is the sick calf?
Karl Hoppe, Ph. D.
karl.hoppe@ndsu.edu
Area Extension Livestock Specialist
Co-Coordinator of ND SARE
Soybean Row Spacing – Opportunities with Paired Rows
NDSU recommends planting soybean in narrow rows to increase yield potential. One option is planting soybean in paired rows. A common configuration is two rows 7.5 inches apart and the pairs centered at 30 inches. Will this type of row arrangement increase yield compared to typical intermediate or wide (e.g. 15- or 30-inch) rows?
The NDSU Carrington Research Extension Center conducted trials during four years (2007, 2015-17) to examine soybean response with paired rows. The research was supported with funding from the ND Soybean Council. Paired row spacing was 7 inches centered at 28 inches. The four-year average yield with paired rows was 45.0 bu/acre compared to 47.5 bu/A with 14-inch rows. The data would indicate no yield advantage with paired versus intermediate rows. The primary reason for the lack of yield response with pairs is the delay in canopy closure compared to intermediate-spaced rows. For example, in the 2017 trial, canopy closure occurred 12 days earlier with 14-inch rows versus 7-inch pairs.
Averaged over three years (2015-17), paired row yield was 41.9 bu/acre compared to 37.8 bu/acre with 28-inch rows, indicating a likely yield response by switching from wide to paired rows.
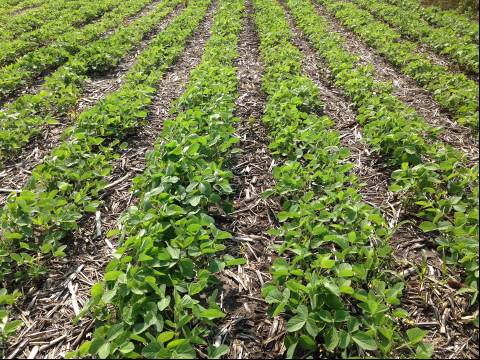
Paired-row Soybean
NDSU currently is conducting work using paired-row configured equipment to plant cover crops between wide-rowed corn and soybean when the cash crops are in the early vegetative stages. For example, if corn is side-dressed with nitrogen, cover crops could be shallow seeded in the paired rows while the N is deeply applied during the 6- to 8-leaf stage. The strategy is to have the cover crop in place with the corn or soybean, with limited interference during the growing season. At cash crop maturity, the cover crop would accelerate growth to provide ground cover and associated soil benefits during the fall and beyond. The research data will be available in the future when the database is adequate to make recommendations.
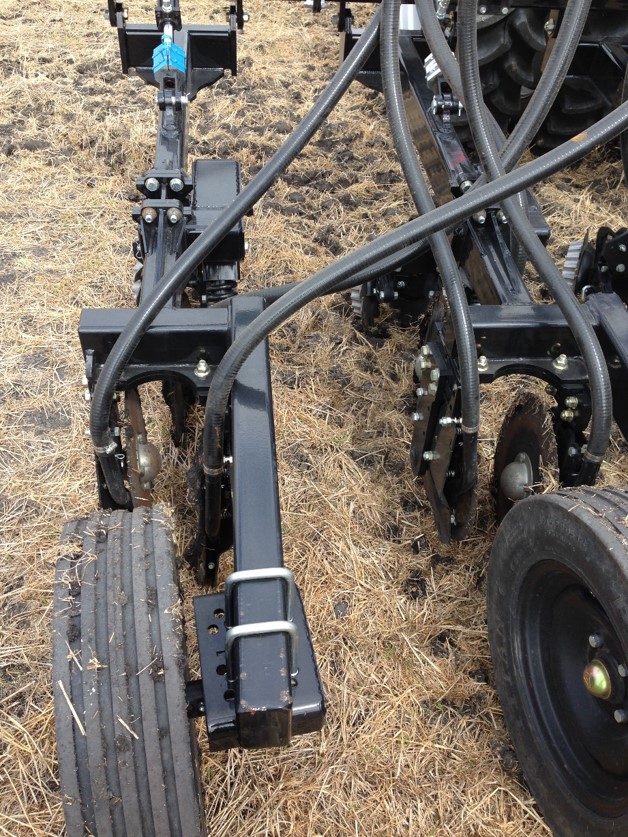
Paired-row Planter
Greg Endres
Gregory.Endres@ndsu.edu
Area Extension Agronomist
Soil Fertility Concerns Following Haying of Crop Fields
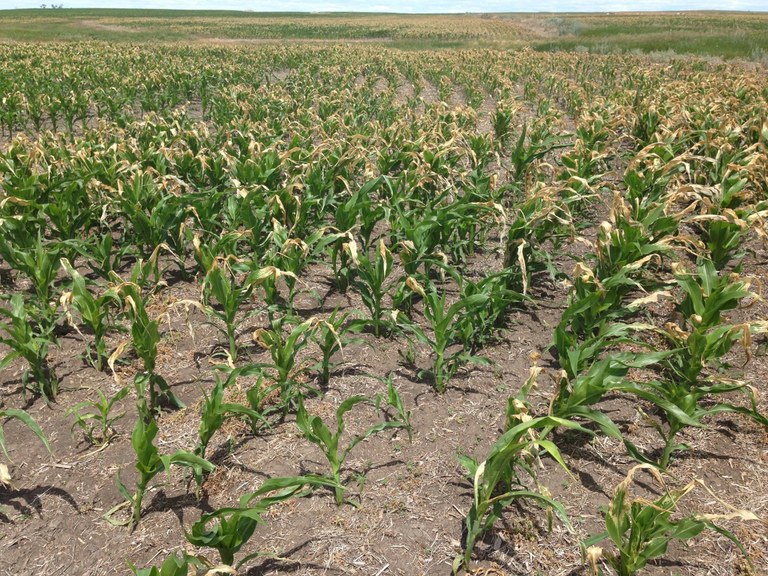
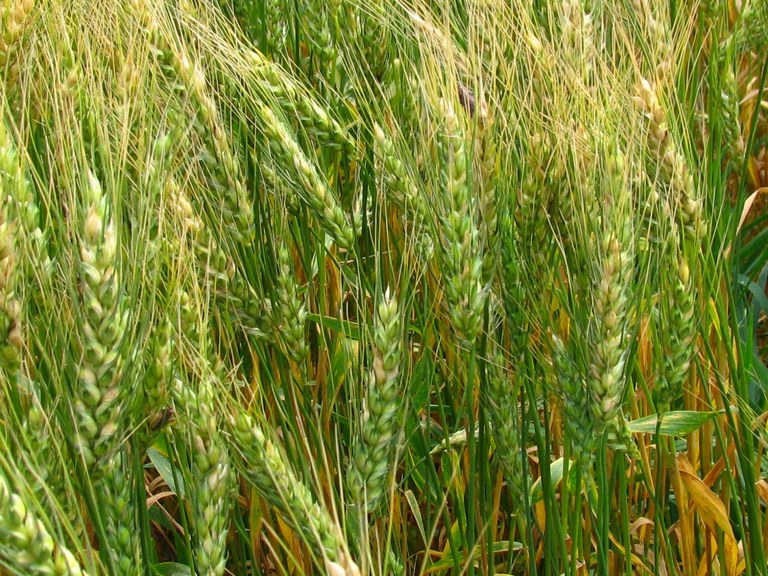
2017 will be remembered for widespread low wheat yields and shortages of hay for livestock in vast areas of North Dakota, due to drought. Prolonged drought conditions left producers with little choice but to salvage what they could from their fields. Many wheat fields were either hayed before maturity or the residue/straws were removed as hay following harvest. Even areas where residue or stubble normally would have been left in the fields for snow capture and water conservation, or erosion control were removed.
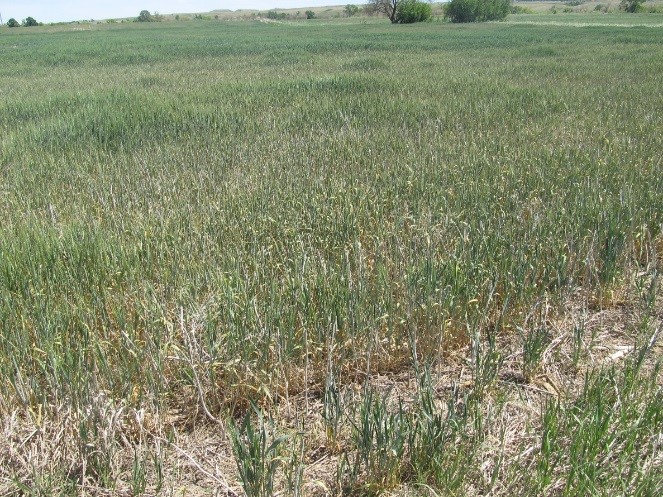
Drought stressed wheat.
Photo courtesy: Ryan Buetow, Area Extension Specialist at the Dickinson Research Extension Center
Some perspectives on residue removal
- Crop residues, left in the field, are major sources of soil organic carbon and soil nutrients which enhance microbial activity, improve soil structure and water retention.
- The most visible effect from removal is soil erosion, which is worsened by annual residue removal.
- To determine the amount of nutrients removed from the field when a crop is baled, follow procedures to take a sample of the bale for analysis, weigh the bale, and determine dry weight (moisture content) of the bale. Sampling protocol available at: http://foragetesting.org/files/hayprotocol.pdf. Or visit the NDSU Extension publication: https://www.ag.ndsu.edu/livestockextension/ranch-hand-newsletter/sampling-feeds-and-testing-for-nutritional-value.
If farmers baled their fields this year, should they be concerned about nutrient deficiencies for the next cropping season?
The answer is no, only if farmers test their soils to know what the current nutrient levels are, even if the soil test levels were high in spring of 2017. Without soil test results, farmers should be concerned especially about macro nutrients like potassium (K) and phosphorus (P) that are sometimes not included in the farmer’s regular fertilization plans. Without soil sampling and testing adequate fertilizer recommendations cannot be made.
K and P fertilizer application may be necessary following residue removal
- Application of K fertilizer will surely be required for soils that had medium to low levels of K (120 ppm or 240 lbs or less in the top 6 inches) at the start of the 2017 cropping season because of high K content in residues.
- Wheat contains a relatively higher proportion of K in the residue than in the grain (about 400% more). For example: a 35-bushel wheat yield removes about 11 lbs of K2O/ac with the grain and will leave about 55 lbs K2O in the residue. When residue is baled, soil K levels can drop significantly.
- Loss of top-soil through wind erosion can cause a reduction of both P and K in the soil.
For fields where whole plants were removed this summer or fall, potash (K) application may be necessary and hay analysis may be necessary with soil testing. For fields where grains only were removed, short term fertilizer planning will depend primarily on soil test results.
Jasper Teboh, Ph. D.
jasper.teboh@ndsu.edu
Research Soil Scientist
