Corn Stand Count Using Unmanned Aerial System (UAS) Collected Imagery
One of the goals for the UAS related research last year at the CREC, was to do stand counts on corn early in the growing season. A secondary goal was to identify appropriate flight height to acquire imagery to perform an accurate stand count.
For this study, we used an area of 0.99 acres (320 ft long by 55 corn rows wide) of a large corn silage field. The corn was planted on May 1, 2016 and was flown on May 23 at 50, 100 and 200 ft above ground level (AGL), using a UAS (AgBot) fitted with a multispectral camera (MicaSense RedEdge). The area was split into 16 plots (ranging from 10 ft long by 5 rows wide to 40 ft long by 20 rows wide), where we visually counted every single corn plant. In addition to those plots, we counted all corn plants in 10 rows up to 320 ft. Those numbers were used to ground truth the counts obtained from the UAS imagery.
At the end of the flights, the images were uploaded to Micasense’s cloud service, Atlas, where they were calibrated and stitched together to form one large image (orthomosaic). We then downloaded the orthomosaic onto our computer and used ArcGIS 10.4 software to calculate the Normalized Difference Vegetation Index (NDVI). We used NDVI to separate the corn plants from the remaining background. To decrease the “background noise” and increase counting accuracy, we grouped the corn plants in rows and deleted the plants between the rows.
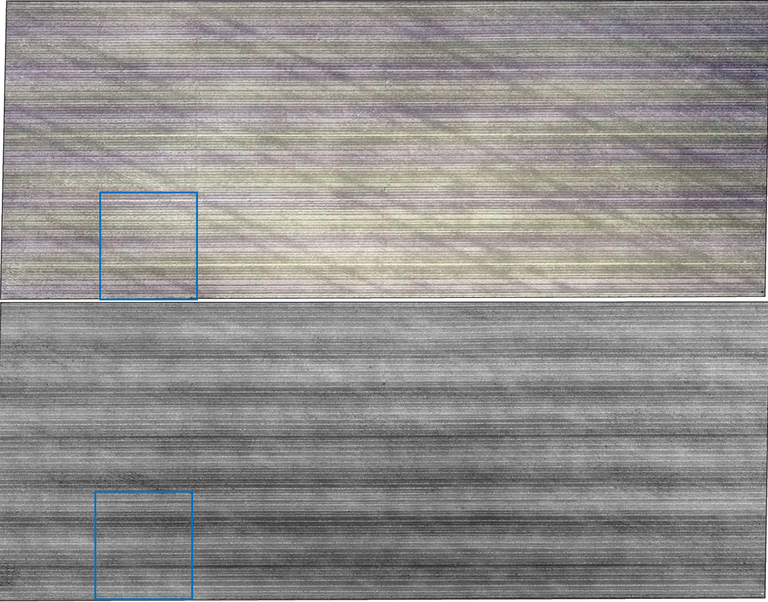
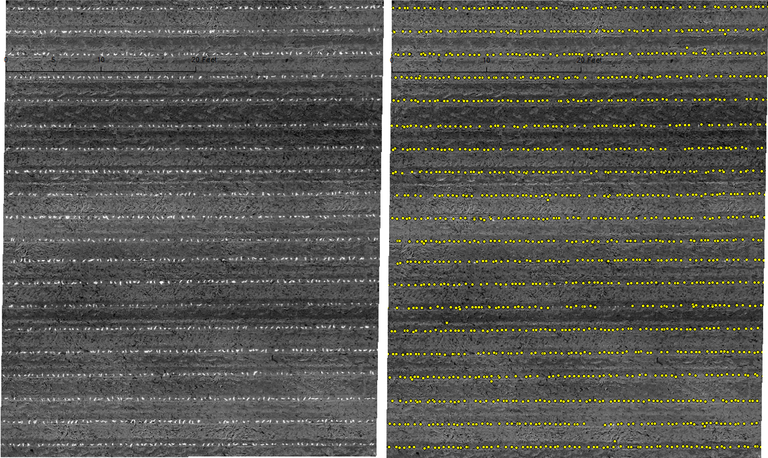
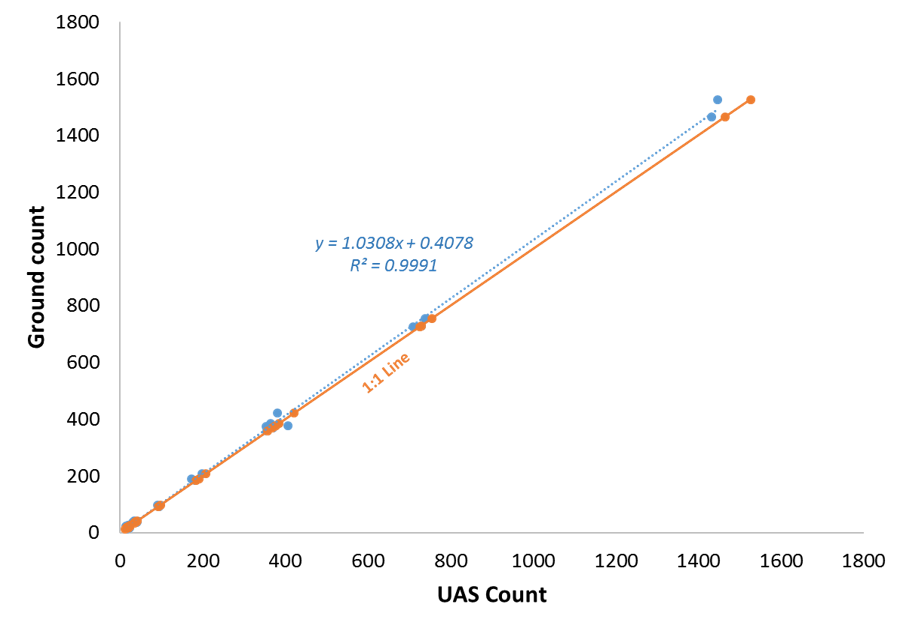
Figure 1 shows a color RGB (Red, Green, Blue) picture (top) and an NDVI (bottom) orthomosaic of the study area. As one can see, it is hard to identify any corn plants (3 leaf stage) on the RGB imagery (at that zoom level). Meanwhile, on the NDVI imagery the corn rows become more noticeable. If we zoom in on the blue box (plot 16, 40 ft wide by 20 corn rows), one can clearly see the individual plants (Figure 2, left). Using the NDVI imagery collected a 50 ft above ground and tools in ArcGIS 10.4, we were able to identify (Figure 2, right) and count the plants in each plot first and then in the whole area (31,297 plants in 0.99 ac). We plotted the number of corn plants that we counted from the imagery versus the number of plants counted in the field for each plot. Figure 3 shows that there was a great correlation between the UAS imagery counting and the ground truth data (blue line); close to a 1:1 correlation (orange line).

Figure 1. Corn study area (0.99 ac). Flown at 05/23/2016 at 50 ft above ground level. RGB mosaic (top) and NDVI mosaic (bottom). Blue box represents the location of plot 16 (in detail below).

Figure 2. Detailed view from plot 16 (40 ft wide by 20 corn rows). NDVI mosaic (left) and plants detected by ArcGIS software (right).

Figure 3. Correlation between stand count from UAS imagery and stand count on the ground (blue line).
In addition to stand count, our method allowed us to locate and count both skips and doubles and to evaluate plant distribution uniformity across the field.
For the 2017 growing season, we are planning on testing the method using a different copter fitted with a higher resolution camera, which will allow us to fly higher and cover more area per flight and further investigate the determination of doubles and skips.
Paulo Flores, Ph. D.
paulo.flores@ndsu.edu
Precision Agriculture Specialist


