

Variety Trial Tips
Cooperatively, one of the most important annual releases of information from the NDSU Ag Experiment Station and NDSU Extension is our variety trial results. The underlying trials represent a large scope of coordinated activity across the state to assist crop producers in making the best varietal decisions for their operation, from large commodity crops to specialty crops. Sometimes the amount of information provided in the variety testing reports can be overwhelming. Here are some ways to maximize the value of the reports:
Mean data: the first thing everyone looks to is yield. It can be time consuming to, for instance, locate the top 5 performing varieties at a location. One place to start is to look for the ‘mean’ (aka average) value at the bottom of the tables. This is an important benchmark because it is easy to then identify which varieties were better or worse than the mean.
Table 1. Example results from a variety trial.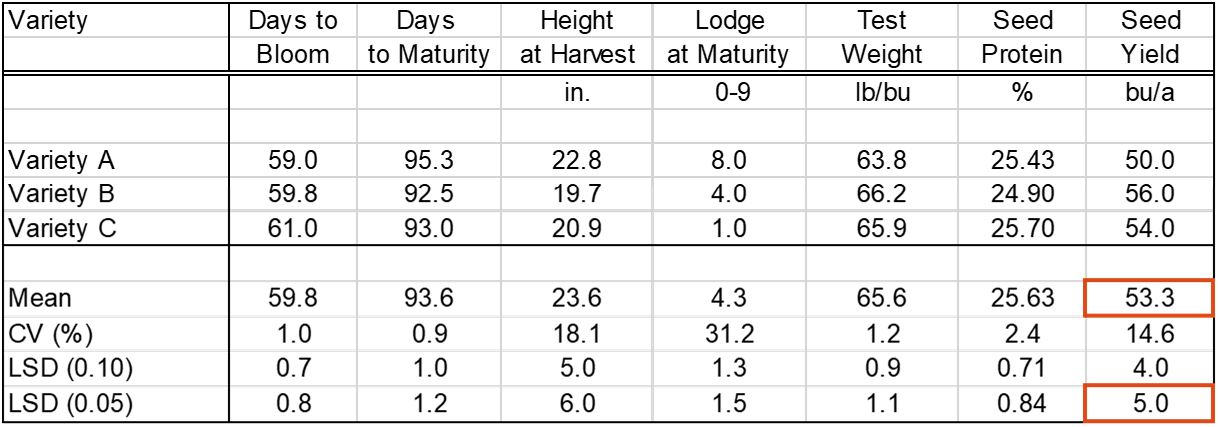
LSD (Least Significant Difference): The tables contain another value at the bottom labeled LSD (0.10 or 0.05). Without going into too much detail, this is a scientific value that indicates the potential range of variability within a trial. In other words, if the LSD (0.05) value is 5 bu/a, it indicates that every instance of a particular variety had a 95% chance of being within 5 bu of its mean. So, if variety A had a yield of 50 bu/a and variety B was 56 bu/a (LSD 0.05), we could say that 95% of time variety B is going to yield greater than variety A. Now what happens when variety C yields 54 bu/a? In this case, we would say that variety C and A are similar (since they are less than 5 bu/a different) because variety A could potentially yield more than variety C at that location at times.
Mean plus LSD: A statistician may chastise the next trick but to quickly find the top performers, you could use a combination of the first two strategies. You can add the LSD value to the mean value. In most trials, there are only a few entries higher than that combined value. You could say that these varieties would be substantially better than the average variety in the trial.
Other factors: We collect data on many other plant characteristics which are often not available from other entities that do variety testing. These may include things like plant height, maturity date, harvest moisture, and lodging. It is more difficult to calculate the direct value/cost of these variables to your operation, but they exist none-the-less. The most important information from these factors might be the outliers. There can be up to 2 weeks difference in maturity between varieties of many crops, or standability differences that affect harvest speed.
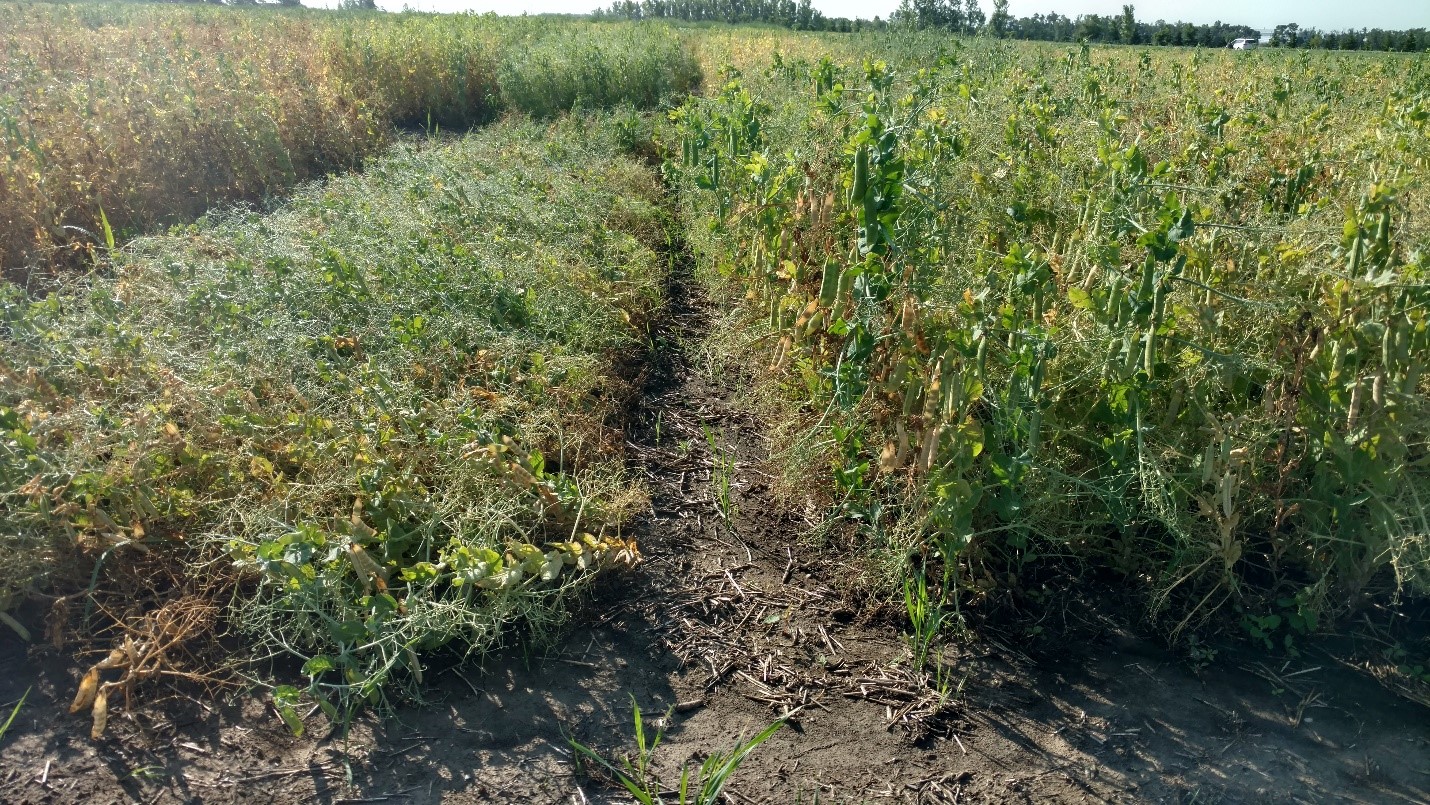 Figure 1. Heavily lodged field peas on the left (rating of 8, Variety A) and good standing peas on the right (rating of 1, Variety C).
You can find the Variety Trial data here: https://www.ag.ndsu.edu/CarringtonREC/crec-variety-trial-data. For more on stats you can read our earlier post titled “Stats for the Rest of Us…How to Read Your Annual Report”.
P.S. If you didn’t see your favorite variety in our trials, talk to your local seed representative and encourage them to submit it to our trials. Our variety trial invitations will be going out soon.
Mike Ostlie, Ph. D.
Mike.Ostlie@ndsu.edu
Research Agronomist
