Unmanned Aerial Systems (UAS) Technology at the CREC
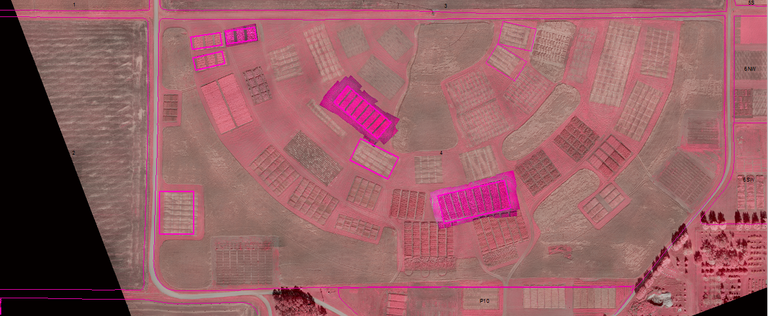
In 2014, the Carrington Research Extension Center was named a test site for studying the integration of unmanned aerial vehicles into civilian airspace. As part of this project, our goal was to make flights around some of the research trials we were conducting to see what information we could collect. Another part of that goal was to take ground-based data and compare it to the aerial-collected data. Most of the images this year were taken with a Dragonflyer quadcopter. Figure 1 was captured with a fixed wing Trimble model.

Figure 1. An infrared image of irrigated research plots at the CREC.
We had several types of information we were hoping to collect including crop fertility, weed control, disease severity, crop moisture stress, crop maturity, and cattle body temperature. Here are some examples of the data we have gather so far:
Table 1. Comparison of ground and aerial-based measurements for yellow foxtail control in spring wheat.

Table 1 is a good example of the comparison between a handheld Greenseeker sensor and the aircraft. NDVI is simply an index that is used in remote sensing to compare the relative health or nutrient levels of a plant. The handheld unit did not provide much information about weed control, and neither did an initial scan of the image taken from the aircraft. However, with the unmanned aerial vehicle (UAV) image, a specific area can be targeted. In this case we looked at weed control in-between the wheat rows and found a nice correlation with the visual estimate of weed control.
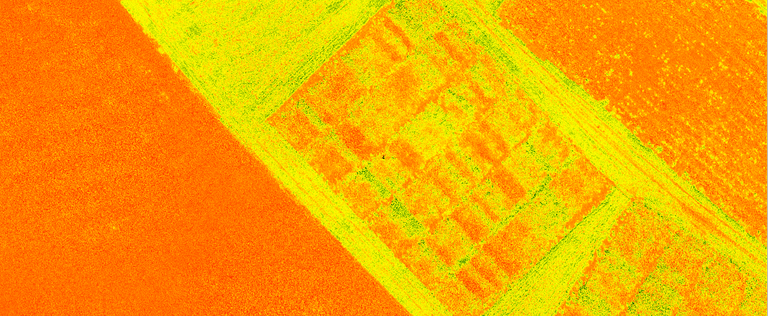
Figure 2 is an NDVI image of a soybean variety trial at the CREC. The picture was taken in late September at a time when many soybean varieties were quickly losing leaves but some later maturing lines still had full foliage. In the picture, green areas represent varieties with many leaves. The dark red colors represent bare ground. So the more red an area is, the more leaves have dropped off the plants.

Figure 2. An NDVI image of a soybean variety trial.
In Figure 3, we quantified the data from Figure 2 and found a fairly strong trend in predicting the date in which soybeans reach physiological maturity.
Figure 3. Predicting soybean maturity using NDVI collected from a UAV. The orange bar represents the date that the flight occurred.
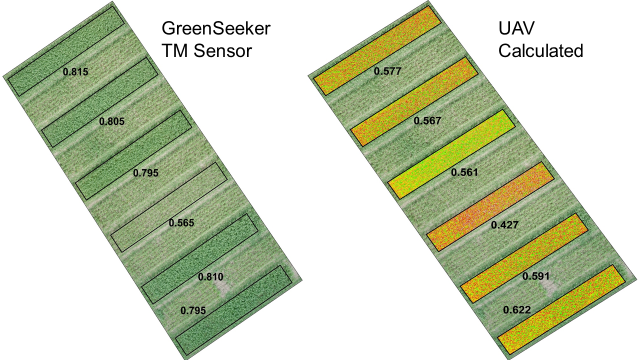
As a final teaser, here is a trial comparing different nitrogen products in wheat. Again, we compared Greenseeker data with the UAV collected data. The actual values are different between the ground-based and aerial-based methods. However, the differences between the values is very similar.

Figure 4. A comparison of nitrogen fertility treatments in wheat using ground and aerial sensors.
This industry is still in its infancy in the United States. There are bound to be great improvements in the speed of processing the data and ease in which it is collected and viewed. While we still have a lot of data to evaluate from this past growing season, we will continue our research efforts in 2015 to see what other information can be gleaned with this new technology. If you would like to learn more or are interested in hearing about our experiences with this technology, feel free to send an e-mail or call the CREC.
Mike Ostlie
Agronomist


