2015
Pasture Water Testing Advised This Year
Pastures were drier than usual this early spring and water pond levels were lower. Recent rains have recharged these stock ponds. However, some stock ponds are still at low water levels.
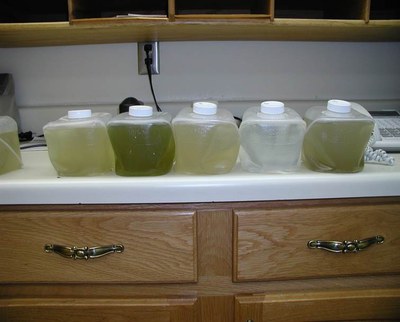
| TDS – Total Dissolved Solids (ppm or mg/L) | |
|---|---|
|
Less than 3000 |
Usually satisfactory for most livestock |
| 3000-5000 |
May not cause adverse effects to adult livestock. Growing or young livestock may be affected with diarrhea or poor feed conversion. |
| 5000-7000 |
Should not be used for pregnant or lactating females. Usually laxative and expect reduced water intake. |
| 7000-10,000 |
Do not use for swine. Do not used for pregnant or lactating ruminants or horses. |
| 10,000 or more | May cause brain damage or death. |
Area Specialist, Livestock Systems
Considerations for Managing Headland Soil Salinity and Soil Compaction
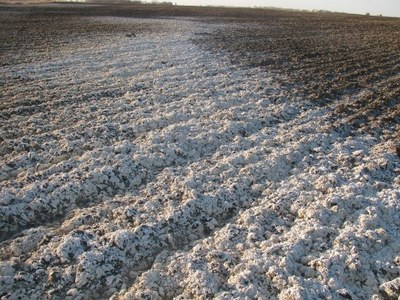
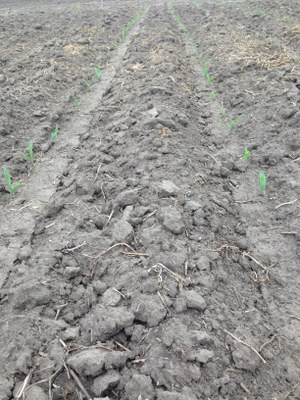
(Picture: Soluble salts on surface of soil south of Carrington, Spring 2015.)
Early spring 2015 was noted for widespread accumulation of dissolved salts on the surface of soil across North Dakota. Due to low precipitation last winter and early this spring, soil water loss by soil surface water evaporation and evapotranspiration by plants exceeded the amount of water received by the soil from rainfall. As soil water moved upward from sub-soil to the soil surface by capillary rise, it brought with it dissolved salts which precipitate/accumulate on the soil surface when water evaporates. Following heavy rains over, 2 inches in many parts of the state, these salts dissolved in and moved with rainwater below the soil surface (called leaching).
One way to improve soil drainage and minimize headland compaction is by planting perennial salt tolerant grasses to build up soil organic matter. Grasses develop abundant roots that contribute carbon to the soil, improve soil porosity, aeration, water infiltration, and enhance microbial activity. Instead of tilling headlands and exposing the soil surface in fall after harvest, let the grass grow. Some producers leave permanent grass strips on headlands approximately 50 feet wide between cropland and ditches to maintain the soil health and minimize salinity. The grass serves as a buffer for heavy traffic on soil, reducing compaction. Take advantage of salt-free topsoil conditions following the rains to plant mixed forage seeds that cannot tolerate salinity during germination. Some salt tolerant grasses include: Tall Wheat Grass, NewHy Hybrid Wheat Grass, Western Wheat Grass, or Alfalfa.
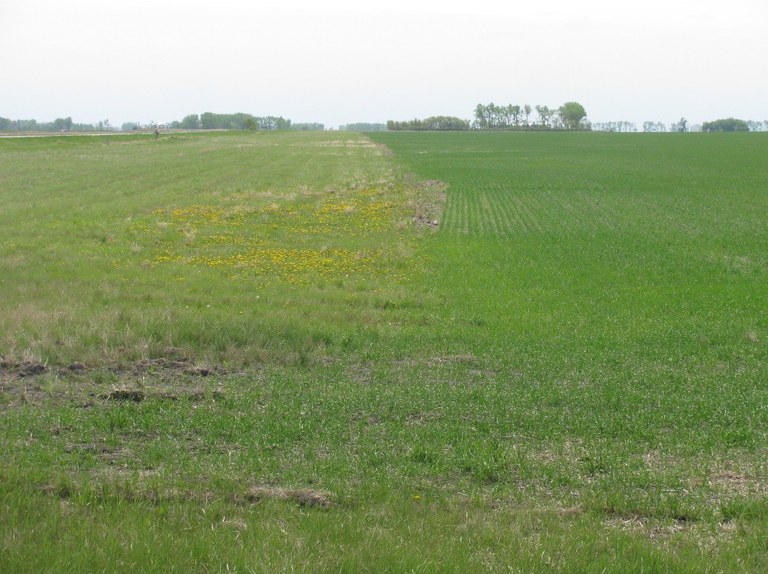
Grass growing on headland approximately 60 ft. wide on a producer's field.
Follow these links for more information:
http://www.ag.ndsu.edu/pubs/ansci/range/r1323.pdf - Grasses of the Northern Plains
http://www.ag.ndsu.edu/pubs/plantsci/soilfert/sf1087.pdf - Managing Saline Soils in ND
Jasper.Teboh@ndsu.edu
Soil Scientist
Narrow Your Soybean Rows
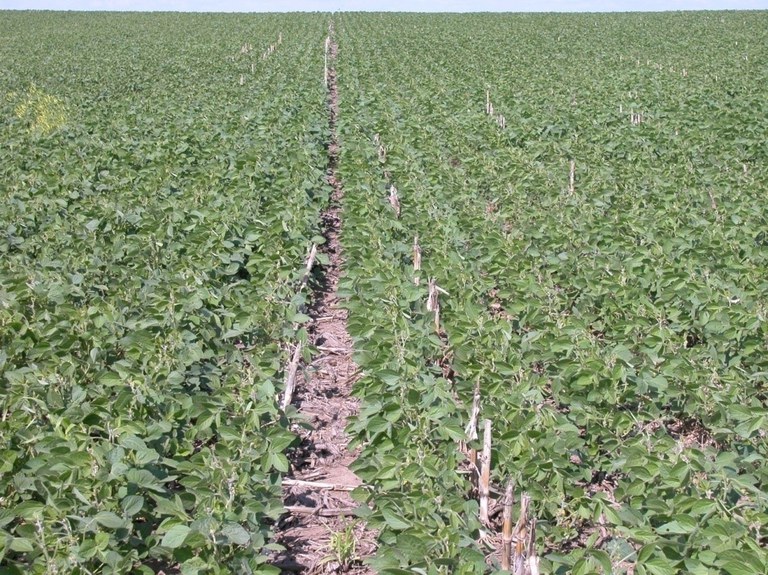
Based on the weather forecast, farmers should be able to resume planting soybean this week. If planting equipment provides the opportunity to plant soybean in narrow rows, this plant establishment method will likely increase yield and profitability. Row spacing less than 30 inches, combined with timely planting and other recommended plant establishment methods, will allow the soybean field to have a full canopy earlier in the season. Early canopy closure allows plants to capture more sunlight, conserve soil moisture and be more competitive with weeds resulting in higher yields.
Averaged over 22 NDSU soybean row-spacing trials, 14- to 21-inch rows had 3% greater yield compared to 28- to 30-inch rows. As an example within this database, 6 site-years (Oakes, Carrington and Minot; 1999-2013) of research shows an average yield of 50.1 bu/acre with 14- to 21-inch rows compared to 48.1 bu/acre with 28- to 30-inch rows. Also, in the same 6-year database, soybean yield averaged 51.3 bu/acre with 7- to 10-inch rows (2% advantage) compared to 50.1 bu/acre with 14- to 21-inch rows.
The North Dakota Farm Business Management Education Program compiles economic data on commercial farms including soybean row spacing. Soybeans produced on cash-rented fields in the Carrington area during 2014 averaged 33.9 bu/acre (7% advantage) compared to 31.4 bu/acre in 30-inch rows. The net return/acre with the narrow rows was $46 compared to $22.50 with wide rows.
Greg Endres
Area Specialist, Cropping Systems
Tree Planting Tips
May is Arbor Month in North Dakota – a great time for tree planting! Trees provide shade, wildlife habitat, beauty in the landscape, and add value to your property. It’s tough being a tree in North Dakota, so follow these tips for a successful planting:
- Locate Logically - Select a site that will provide space for the tree – above ground and below. Roots need space, too. Select a small-statured tree like an amur maple or flowering crab for a small space.
- Choose Carefully – Species diversity is the key to resiliency against pests and environmental challenges. The NDSU Plant Sciences Woody Plant Improvement Program has introduced over 50 selections of superior woody plants with increased disease tolerance and winter hardiness (http://www.ag.ndsu.edu/plantsciences/research/introductions.) Choose one of these! Prairie Expedition American elm, Prairie Stature hybrid oak, or Prairie Torch hybrid buckeye. You may have to search to find these trees, but they’re worth the effort.
- Plant Properly – Tree planting is an ancient art, but the methods have changed to reflect the latest and best arboricultural and forestry research. Size and shape of the planting hole have become a very important part of the planting process. Dig the hole WIDE and SHALLOW, just deep enough so the roots are located right beneath the soil surface. Roots need oxygen to absorb water and nutrients. A deeply planted tree may survive, but cannot thrive. Remove the root ball from the container, and set the plant on firm ground. If the roots are pot-bound, tease out some of the roots and slit the sides of the rootball with a knife. Shovel backfill into the hole, continuing until roots are covered.
- Fertilize Frugally – Don’t fertilize at the time of planting – it may cause root injury. Fertilize lightly next year.
- Water Well – use a low pressure hose to water and settle the soil. When done, the planting area should be well-soaked and moist backfill should barely cover the top of the rootball. Frequency of watering depends on the soil, not the calendar. Deep, infrequent watering is better than shallow, frequent sprinkling of the soil surface.
- Mulch Meaningfully – Mimic Mother Nature by placing an organic mulch of wood chips or shredded leaves around the tree. A layer 3-4” deep, out to the dripline of the tree and away from the trunk will help conserve moisture, inhibit weed growth, and prevent mower damage.
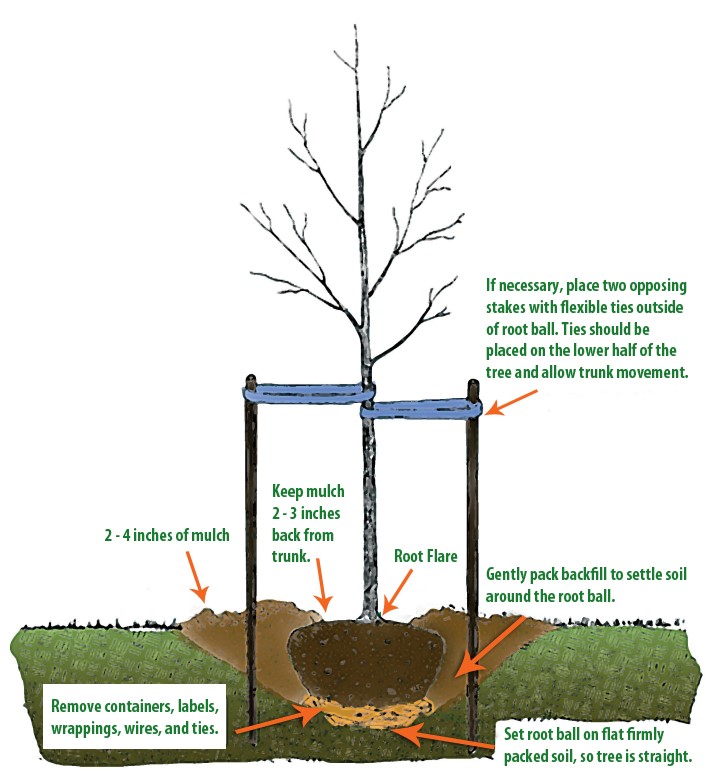
Diagram from International Society of Arboriculture
www.treesaregood.com
Watch your tree grow. Happy planting!
Gerri Makay
Community Forestry Program Manager
ND Forest Service
Gerri's office is located at the CREC.
Bees are Our Friends…and so are Snakes. Yes, Snakes.
For several years, I have given orchard tours to first graders. It’s a good place for them to run around! But what to tell them??? I chose something simple – honeybees. We talk about how important they are, tell bee jokes and do the bee dance. But the most important part is “Bees are our friends”. Bees don’t want to sting you, they just want to gather nectar and make honey. Hold still and they should go away. Most stings are an accident. The mean insects that may chase and sting you are hornets and wasps - not bees. Hard for a kid to see the difference, but at least they have the notion that “Bees are our friends” in their heads.
Now for you adults….. Let’s talk about “Snakes are Our Friends.” Yes, really! There are NO snakes poisonous to humans in the Carrington area. Like bats and spiders, which I know also creep you out, they are doing us a HUGE service by controlling pests. In general, snakes eat tons of insects, slugs, worms, frogs, salamanders, fish and rodents like mice, voles and gophers. In turn, snakes are eaten by coyotes, fox and hawks.
Our very common garter snakes would rather not be near you. If you just stomp near them, they will just move off and be on their way. Yes, they are startling when they surprise you, but PLEASE don’t kill them. Habitat loss is already putting all reptiles and amphibians in danger. Just agree to both be startled and ‘run’ away from each other. If kids can come up to me, when they see me later, and say: “Bees are my friends”, I know you can just walk away from the next snake you see.
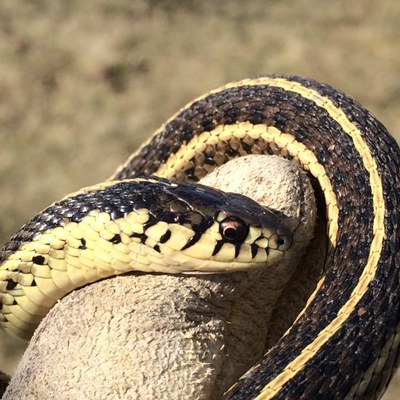
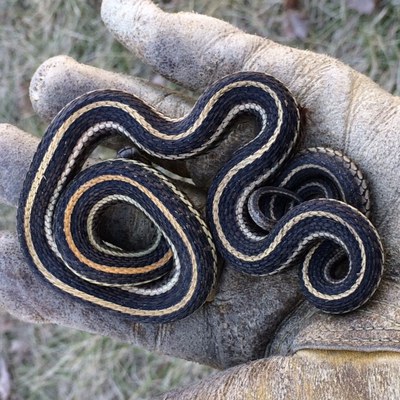
Last week, while pruning on a warm day, I came across two yearling garter snakes. For sure, one is a Plains garter snake with its orange midline; the other one may just be indistinct. They were pretty frozen in defense while I took the pictures. I released them back to a warm sunny spot, hoping to see them bigger in the future. I appreciate them for eating the grasshoppers, crickets and those rotten, chewing voles that love tree trunks. For more pictures of these two, go to the Fruit Project’s Facebook page: www.facebook.com/crecfruit.
The following links contain information on garter snakes and other species:
- http://www.und.edu/org/ndwild/reptile.html
- http://herpnet.net/northdakota-herpetology/snakes-of-north-dakota
- http://www.gartersnake.info/species/
- http://snakesarelong.blogspot.com/2013/08/what-state-snakes-should-be-part-ii.html
Kathy Wiederholt
Fruit Project Manager
Making the most of NDAWN
What’s the weather like around ND?
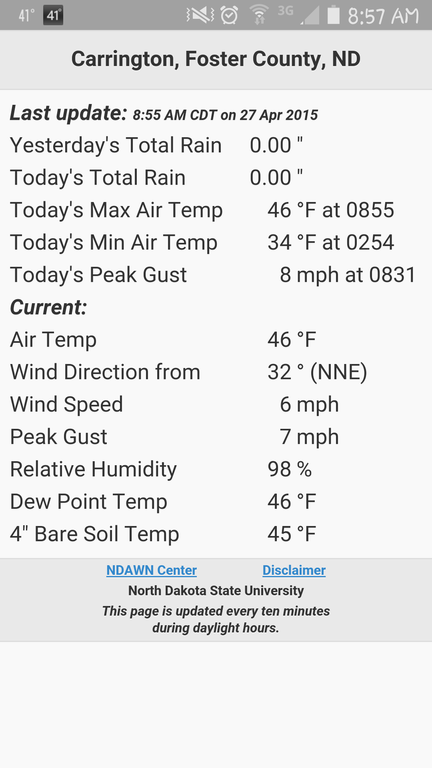
Instantaneous weather data is available at many sites across North Dakota.
The Carrington REC is a station cooperator for one of 72 NDAWN stations in North Dakota, far western Montana and northeastern Minnesota. As part of the North Dakota Agricultural Weather Network (NDAWN), each monitoring station collects wind speed and direction every five seconds. Air temperature, relative humidity, solar radiation, and soil temperature are measured every 60 seconds. The NDAWN website displays data every ten minutes, but specific intermediate data points are available via online search.
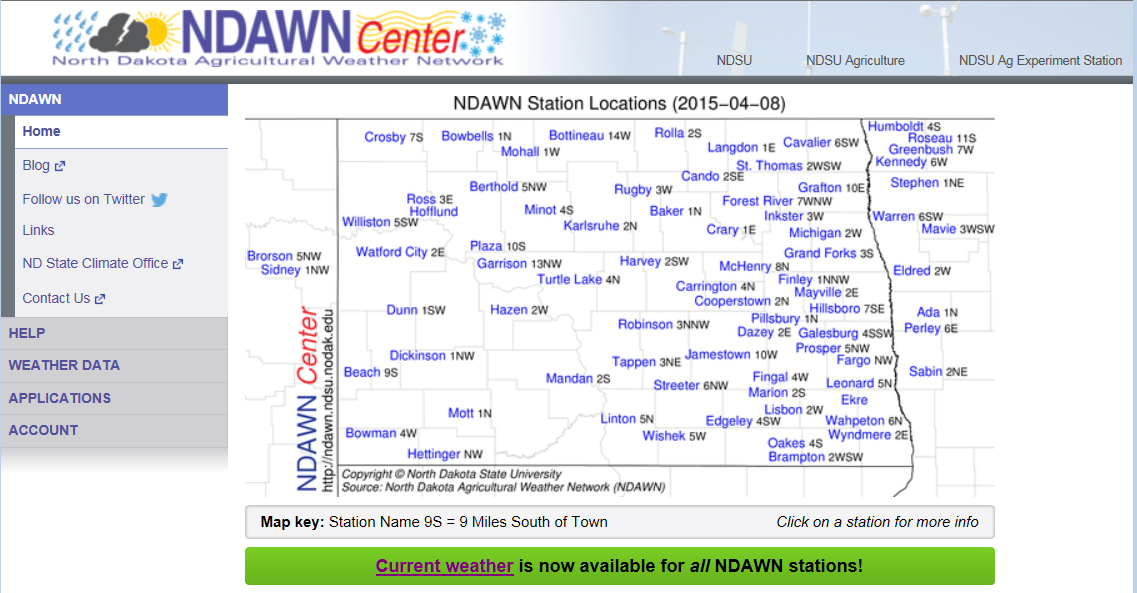
The main NDAWN site at http://ndawn.ndsu.nodak.edu/ displays a map with all of the locations.
Measurements transmitted to the ND State Climate Office (NDSCO) include air temperature, soil temperature, wind speed and direction, rainfall, barometric pressure, relative humidity, and solar radiation. With this information, the NDSCO calculates dew point, potential evapotranspiration, and wind chill, and logs daily minimums, maximums and averages.
Some sites, including Carrington REC, have deep soil temperature probes in addition to standard soil surface and turf monitors.
The NDSCO uses NDAWN data to fuel several agronomical tools such as Growing Degree Day (GDD) calculators, to forecast crop disease potential and insect pressure, and to provide support for estimating crop water use and scheduling irrigation.
Last summer, all of the stations were upgraded from landlines to cellular modems for constant contact with the NDSCO. Technical details on the changeover are available here http://www.ndsu.edu/ndscoblog/?page_id=318 .
Now, anyone with a smartphone or computer can monitor simultaneous NDAWN data from anywhere in the world, free of charge. Detailed instructions for smartphone users who wish to create bookmarks on their device home screen are located at http://ndawn.ndsu.nodak.edu/help-smartphone.html .
Historical records, dating back to 1991 in some cases, can easily be viewed or exported.
The Carrington REC first installed an automated weather station in the summer of 1983 as a research tool. Data storage capacity was limited to one week’s measurements, the unit recorded high and low temperature and precipitation (but not the duration of any trends) and CREC staff had to manually retrieve the data. At that time, data was shared directly with the High Plains Regional Climate Center at the University of Nebraska-Lincoln using a dial-up modem. The following years, the Main Station at Fargo and several other REC’s installed similar weather stations and a weather network was formed in 1989 with the existing six automated weather stations. Later, weather stations sponsored by private and public organizations were formed into the NDAWN network.
We, of course, are partial to the Carrington station, although we also find great value in the NDAWN stations at Linton, Wishek, Oakes, Fingal, and Dazey because of their proximity to many off-station agronomy trials conducted by the CREC.
Linda Schuster
Administrative Secretary
Corn starter fertilizer trial summary: NDSU recommends starter phosphorus for corn
 NDSU recommends applying starter phosphorus (P) fertilizer for corn to promote early season plant growth and increase grain yield potential. Starter fertilizer should be band-applied within two inches of the seed, either in-furrow (IF) or side-band. Generally, the ‘starter’ effect can be achieved with 2.5-3 gpa of 10-34-0.
In CREC corn trials conducted during 2007-10 on soils testing low to medium for P (5-10 ppm Olsen test), yield averaged 124 bu/A with IF 10-34-0 applied at 2-4 gpa compared to the untreated check at 112 bu/A. When the rate of IF-applied 10-34-0 was raised from an average of 3 gpa to 6 gpa, yield increased 7 bu/A. Approximate cost of 10-34-0 is $3/gal averaged across 7 CREC trials conducted in 2008-10, yield response with 5-6 gpa 10-34-0 applied IF compared to a 2-inch band was similar (both placement methods resulted in 127 bu/A).
2015 corn fertilizer trial treatments planned with 10-34-0 include broadcast, pre-plant incorporated versus a starter band; IF plus 2-inch band versus sole starter application methods; and IF 10-34-0 versus 6-24-6.
Greg Endres
Area Specialist, Cropping Systems
Long-term Cropping Systems Study
In 1987, a long-term cropping systems study started at the NDSU Carrington Research Extension Center. Three sets of 4-year crop rotations are replicated three times each year. The seventh cycle ended in 2014.
The original base rotation, maintained until 2003, was: Hard Red Spring Wheat/Sunflower/Barley/Fallow. At the beginning of the fifth cycle in 2003, the base rotation was updated to replace Fallow with Soybean. The other two current rotations are: Hard Red Spring Wheat/Field Pea/Corn/Soybean, and Hard Red Winter Wheat/Corn/Soybean/Canola. The last rotation includes a cover crop vs. no cover crop component after Hard Red Spring Wheat and Soybean are harvested each year. Each crop within each rotation is planted every year.
The fertilizer treatments are: (1) urea broadcast applied each spring to all plots, except field peas and soybeans, at 0, 50, or 100 pounds of N per acre and (2) composted beef feedlot manure applied once at 200 pounds of N the first year of each cycle. These treatments are imposed in strips perpendicular to the three tillage systems: conventional, minimum tillage, and no till resulting in 12 sub-plots within each crop.
Data is collected consistently on total crop biomass, grain production, and the effects of crop rotations, tillage system, and N fertility treatments on subsequent crops. Soil data on nitrogen, phosphorous, organic matter, and pH is also collected.
Data on soil moisture status, soil aggregate stability, weed pressure and disease pressure have also been collected as time and resources have permitted.
The goal of the study is to determine the affects of tillage system, N fertility level and source, and crop rotation and the combination of these parameters have on crop grain and biomass production, crop diseases, soil nitrogen, soil phosphorous, soil organic matter, and soil pH.
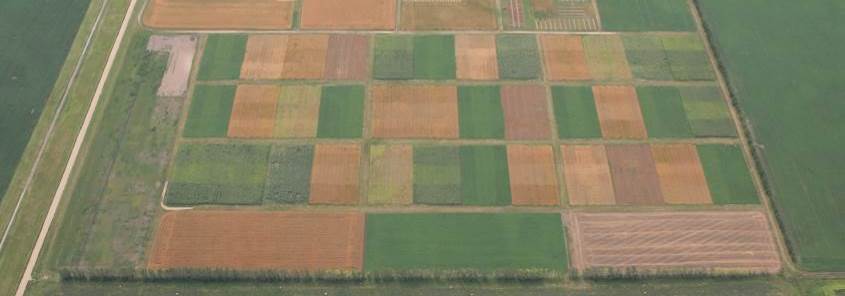
In this photo you can see the different crop plots with the tillage systems
running vertically and the N fertility rates running laterally in the plots.
Some key long term findings from this and previous cycles are:
- Normal precipitation and temperature at our location shows no differences in yield based on tillage system.
- Soybean yields are the same whether it follows wheat, barley, or corn.
- Corn following field pea has a significantly higher yield (6.5 bu/acre) than corn following winter wheat.
- The no-till system has significantly higher organic matter content at 3.7% than conventional tillage at 3.4%, and minimum tillage at 3.5%.
- Composted manure plots have significantly higher organic matter content at 3.8% than the 100 lbs. urea plots at 3.6%, the 50 lbs. urea plots at 3.5%, and the no fertilizer plot at 3.3%.
- Composted manure plots have significantly higher soil pH at 7.2, than the no fertilizer plots at 6.6, the 50 lbs. urea plots at 6.4, and the 100 lbs. urea plots at 6.0.
- Composted beef feedlot manure is an excellent economical fertilizer if available. Crop yields are equal to and some times greater than equivalent amounts of commercial nitrogen fertilizer. Find out more about the economics here: http://www.ag.ndsu.edu/CarringtonREC/center-points/economics-of-a-long-term-cropping-system-at-the-carrington-rec.
Ezra Aberle
Agronomy Research Specialist
One Year of Center Points Blog Posts!

Today marks the one year anniversary of Center Points. As I look back through the 52 posts I realize just how much we have shared over this past year. From Seedstocks to sulfur deficiency, agronomy to ag business, fertilizer to fruit, and everything in between, we have shared the latest research, demonstrations, and information with the intent that you can implement these practices on your own farm or ranch or around your home.
As we end Year One of Center Points, I would like to share some information about where our readers are from:
- The Center Points blog has been viewed over 10,000 times and those of you viewing the blog have spent approximately 3 minutes doing so (that’s why we try to keep them short!).
- 20 countries have viewed the Center Points blog. The top 5 viewing countries are:
- USA
- Canada
- Australia
- Turks and Caicos Islands
- Finland
- The top 5 cities in North Dakota reading the Center Points blog are:
- Carrington
- Fargo
- Bismarck
- Jamestown
- Minot
- The top 5 out-of-state cities reading the Center Points blog are:
- Minneapolis, MN
- Moorhead, MN
- Johnston, IA
- Creve Coeur, MO
- Sioux Falls, SD
As we prepare for another year of Center Points blog posts, we ask that you take 7-10 minutes to fill out the 12 question survey found here: https://ndstate.co1.qualtrics.com/SE/?SID=SV_6nShQLI5O8dtlxr.
This survey will enable us to improve Center Points and gear it more toward your needs. We appreciate your faithful readership and look forward to sharing with you for another year!
Mary Berg
Livestock Environmental Management Extension Specialist
Feed & Bunk Management for Cattle Feeding
‘Many an experienced stockman can carry steers thru the fattening period without getting them once “off feed,” but yet cannot well describe to others just why he is so successful.’ Feeds and Feeding - Henry and Morrison, 1928.
When we feed cattle the goal is to control the amount of variation we have within a feeding system: We want to deliver the same feed, at the same time, with the same quality, and in the same quantity every day! We want to optimize consistency in the way we do these things to improve cattle health and ultimately profitability.
Bunk management is the most inexpensive way to improve feed to gain, and allows cattle feeders the ability to deliver the same quantity and quality of feed every day to cattle minimizing variation. Managing bunks ultimately manages nutrient and energy intake, as well as ingestion of vitamins, minerals, and feed additives of cattle diets. Our goal when feeding cattle is to get a consistent and stable fermentation in the rumen, which improves the efficiency of any diet. The goal is not to maximize intake, but rather to minimize satiety. When this is the goal we want to “prescribe” the feed delivered or manage bunks, not use an ad libitum feed delivery. Prescribed feeding improves live animal performance compared to ad libitum feeding (Figure 1) and it is not cost prohibitive to implement.
Figure 1.
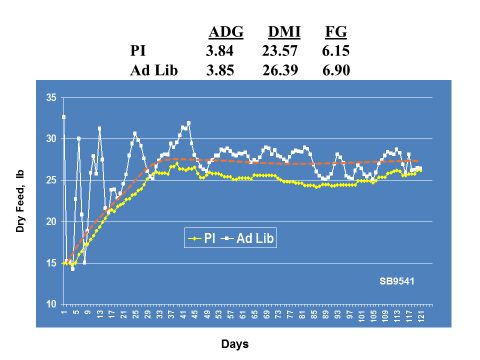
PI-prescribed Intake
Ad Lib-Ad libitum intake
There are minimal tools needed for bunk management: a bunk sheet with at least 4 days of previous feed deliveries and the corresponding bunk/cattle scores (which you can develop a system that works best for your operation), a spreadsheet or graph paper to track intakes, an observant and responsive personality to monitor cattle behavior, and you must be honest with yourself about the calls you make. These bunk management records or the feed calls should include previous feed deliveries, bunk & cattle scores, any feed schedule changes, and any batch changes at the mixer. To be a successful bunk reader/manager you have to know where the cattle have been: feed leftover, fines or roughages left, loose stools, how fast cattle clean up the feed, which is why records are important to an operation.
Reading bunks requires an individual to be very observant not just at the bunk, but within a pen of cattle too. What are the cattle doing, what is their interest at the bunk, how do their stools look, what is the temperature like, how many days on feed are they? These are all questions to ask yourself just about the cattle. And what do the bunks look like: Is there a uniform feed mix and delivery, are their fines or roughages left because cattle are sorting, what is the apron condition like (do cattle have to work to get to the bunk?), are the bunks dirty or wet? These are all questions to take into account when reading bunks. You also want to pay attention to how quickly cattle are cleaning up the feed delivered, which requires another trip past the bunk. If you feed in the morning and cattle have the bunk slicked by 1 pm, you are behind the cattle and holding them back on intake. We ultimately want to get cattle eating behavior in line: minimize the potential for binge feeding or getting behind the cattle. We also want to minimize feed sorting and avoid allowing cattle to develop aggressive feeding behaviors. This will keep cattle on feed and improve live cattle performance.
In addition to bunk management, the long time standard has been feeding within 15 minutes of the same time every day. “Cattle should be fed at certain hours and in the same way. This cannot be varied 15 minutes without some detriment to the cattle. The extent of insult will depend upon the frequency and extent of irregularity….” Mumford (1908). Research of feeding at random times shows the adverse effects on live cattle performance (Figure 2 & 3). An easy way to see how you are doing is record on your feed sheet what time you feed every day.
Figure 2.
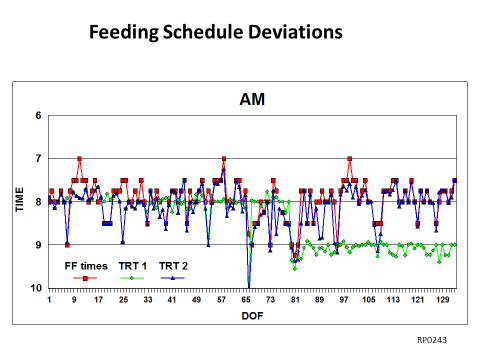
FF-no scheduled feeding time
TRT 1- Regularly scheduled feeding time
TRT 2- No scheduled feeding time
Figure 3.

Records are an integral part of cattle feeding. This becomes very evident when trying to minimize variation within an operation. The challenge is not only capturing the records needed, like intake and what is actually being fed, but then evaluating variation within those records to make improvements in the operation. Similar to manufacturing processes, quality control can be used in a few different areas of the feedlot to target key sources of variation. These areas include ingredient composition (same quality), feed batching & mixing processes (same feed), feed calls & feed deliveries (same quantity), and schedules (same time). Minimizing variation in these areas will improve your operations profitability and ability to feed cattle.
Anna Taylor
Animal Scientist

