2014
Dakota Feeder Calf Show Calves Are On Feed
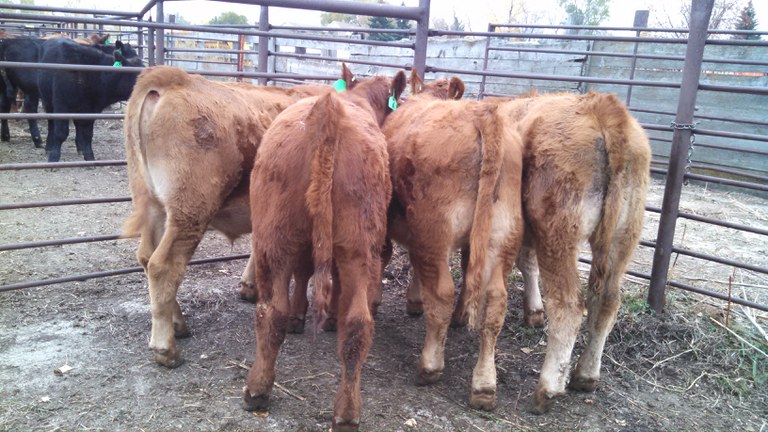
Turtle Lake hosted the 16th annual Dakota Feeder Calf show on October 18, 2014. Cattle producers from across the state consigned 154 head of weaned steer calves. These calves were exhibited at the Turtle Lake weighing station and then shipped to the NDSU Carrington Research Extension Center feedlot for feeding until finish.
Forty-five producers and businesses will learn individual feedlot gain and carcass characteristics including ribeye area, backfat, marbling (prime, choice or select) and yield grade. Overall feed conversions and costs will be calculated.
Last year’s feed cost per pound of gain was $.574 while overall cost of gain was $.828 per pound. This year the feed only cost is estimated at $.42.
In the 2013-2014 Dakota Feeder Calf Show, the top profit five ‘pens-of-3’ steer groups averaged 3.85 pounds per day weight gain. The average of all pens was 3.62 pounds daily gain. The difference in profit between the high group and the average was $75 per head. The different between the average and the low profit group was $74 per head.
This project provides producers with knowledge about calf genetic performance from their cow herd, provides experience in custom cattle feeding, and celebrates the cattle industry in Central North Dakota.
Karl Hoppe
Area Specialist, Livestock Systems
Overview of CREC 2014 Spring Wheat Variety Performance Trials
The following are highlights from the Carrington Research Extension Center’s 2014 spring wheat variety trials:
- CREC Dryland: Trial had an average yield of 91.7 bu/acre and 60.5 lb/bushel (test weight) among 48 commercial varieties. Varieties yielding over 100 bu/acre (range of 100.0-110.9 bu/acre) in the 2014 trial included Croplan HRS3361, Croplan HRS3419, Faller, Jenna, LCS Albany, LCS Nitro, MS Stingray, MS Chevelle, Prosper and WB9507. Among varieties tested during the past 3 years, the variety reaching an average over 70 bu/acre was Faller at 72.4 bu/acre.
- CREC Irrigated: Trial had an average yield of 65.9 bu/acre and 60.1 lb/bushel among 47 commercial varieties. Varieties yielding over 80 bu/acre (range of 82.8-85.8 bu/acre) in the 2014 trial included Faller, MS Stingray and Samson. Among varieties tested during the past 3 years, those varieties reaching an average of over 70 bu/acre (range of 70.3-75.2 bu/acre) included Elgin-ND, Faller, Jenna, LCS Powerplay, MS Stingray, Prosper and Samson.
- Barnes County (Dazey): Trial had an average yield of 90.5 bu/acre and 60.6 lb/bushel among 34 commercial varieties. Varieties yielding over 100 bu/acre (range of 101.7-109.7 bu/acre) in the 2014 trial included Faller, MS Chevelle and Prosper. Among varieties tested during the past 3 years, the variety reaching an average of over 80 bu/acre was Prosper at 80.3 bu/acre.
- Tri-county (Wishek area): Trial had an average yield of 70.3 bu/acre and 53.8 lb/bushel among 34 commercial varieties. Varieties yielding over 80 bu/acre (range of 80.5-83.2 bu/acre) in the 2014 trial included Barlow, MS Stingray and Prosper. Among varieties tested during the past 3 years, those varieties reaching an average over 55 bu/acre (range of 55.0-56.1 bu/acre) included Jenna, Prosper and Select.
Complete databases for the above trials can be found at the following website: www.ag.ndsu.edu/varietytrials/carrington-rec/2014-trial-results.
Greg Endres
Area Specialist, Cropping Systems
Economics of a Long-term Cropping System at the Carrington REC
In 1987, a long-term cropping systems study was initiated at the NDSU Carrington Research Extension Center (CREC). The study consists of cycles of three, 4-year crop rotations with three replicates (See figure below). In 2003, at the beginning of the fifth cycle, the base rotation was updated to reflect the changes in crop production that occurred since inception of this study. The seventh cycle began in 2011. The new base rotation is: Hard Red Spring Wheat - Sunflower - Barley - Soybean (Rotation 1). The other two current rotations are Hard Red Spring Wheat - Field Pea - Corn - Soybean (Rotation 2) and Hard Red Winter Wheat - Corn - Soybean - Canola (Rotation 3). The last rotation is also split to include a cover crop vs. no cover crop component between each grain crop. Each crop within each rotation is planted every year.
The goal of the study is to determine the singular or combined effects of crop rotation, tillage system, N fertility levels and sources, on crop grain and biomass production, crop diseases, soil nitrogen, soil phosphorous, soil organic matter, and soil pH.
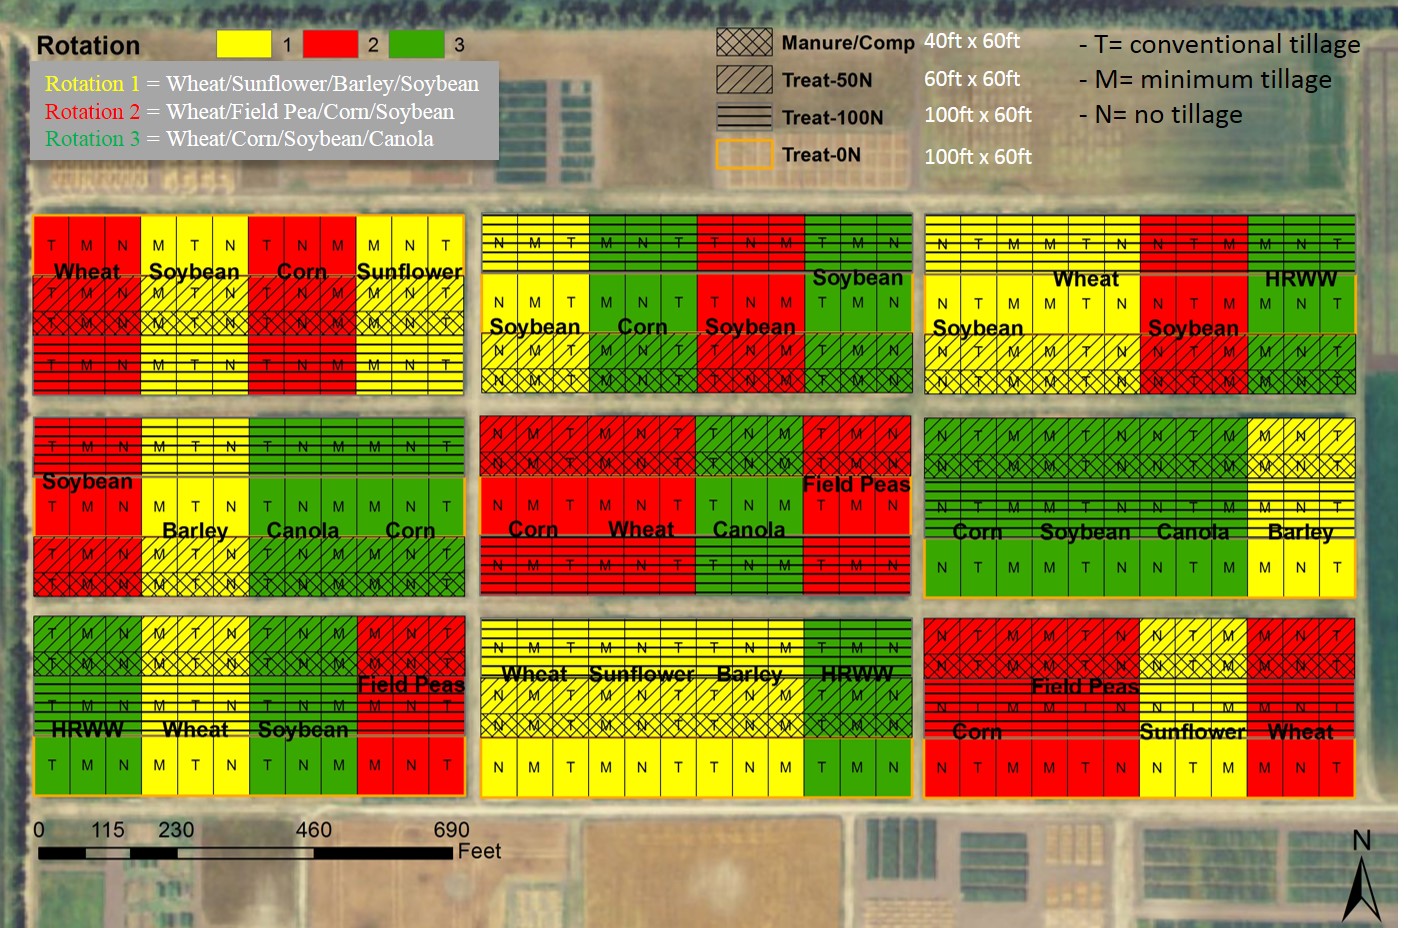
Tillage treatments (conventional, minimum and no-till) are imposed along the North-South direction, while the fertility treatments (nitrogen rates and sources) are imposed along the East-West direction (pictured above). Urea is used as an N source and it is applied each spring to non-leguminous plots at 0, 50, or 100 lbs. of N/ac, and composted beef feedlot manure is applied once in the spring at a rate of 200 lbs. of N/ac on the first year of each cycle. As seen on the picture above, this arrangement of the treatments yields 12 sub-plots within each crop plot.
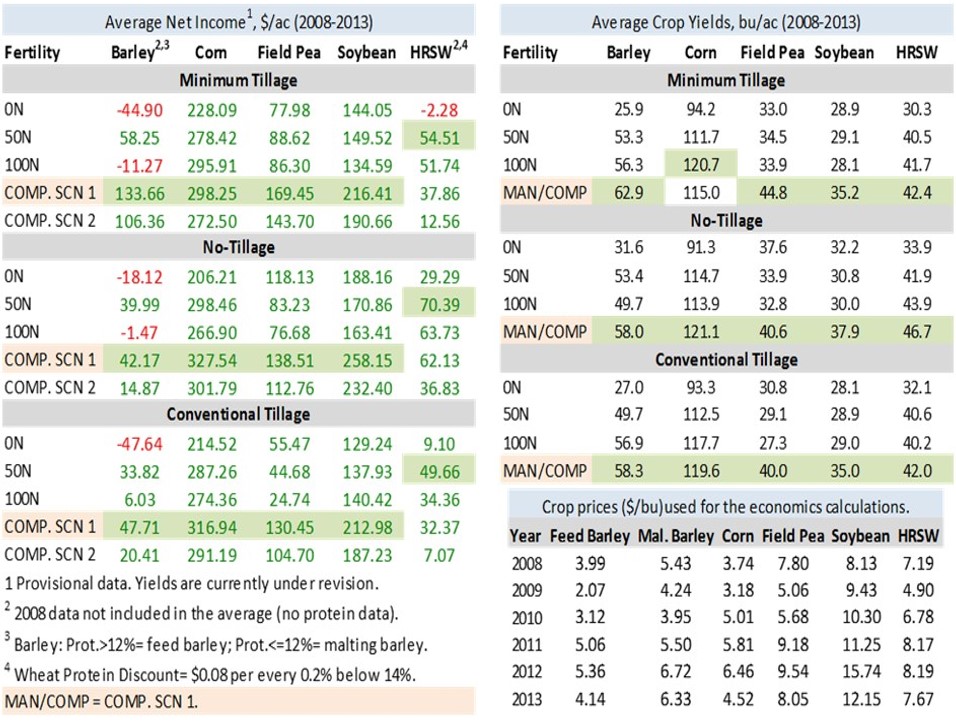
Previous statistical analysis of yield data for this trial showed that tillage and fertility treatments are mains factors affecting crop yields. Earlier this year we decided to look at the economics of some of the crops planted within this long term cropping system. The crops (barley, corn, field peas, soybean and hard red spring wheat (HRSW)) and period of time (from 2008 to 2013) covered on this article were based on the availability of data to compute the production costs (tillage, fertilizer, seeds, chemicals, seeding, combining, overhead and land) and gross return (crops yield and prices). The economics were run based on two scenarios: Scenario 1 (SCN 1) – you own the compost and your only cost would be to haul it; Scenario 2 (SCN 2) – you pay for unit of N in the compost the same price paid per unit of N in commercial fertilizer.
Some notes about the tables above and findings of this study:
- Green and red numbers represent, respectively, positive and negative net income. The higher values for both average net income (left) and average crop yields (right) are highlighted in green.
- As an average of 6 years, the beef feedlot composted manure under scenario 1 (COMP. SCN 1) showed higher net income in all tillage systems for barley, corn, field pea and soybean.
- Under scenario 2 (COMP. SCN 2) that treatment showed to be more profitable in all tillage systems for field pea and soybean.
- The lower net income seen for barley with 100 lbs. N/ac was due to its higher protein content (>12%), which led to a lower price paid for product (feeding barley).
- It seems that there is an interaction between minimum tillage and the 100 lbs. N/ac, where barley protein content was >12% in 4 out of 5 years of data.
- For HRSW, the 50 lbs. N/ac rate showed to be the most profitable treatment in all tillage systems.
- As an average of 6 years, with the exception of corn under minimum tillage, the beef feedlot composted manure treatment out yielded the other treatments by at least 2 bu/ac for all the crops listed on the table above.
- The higher HRSW yields seen on the manure treatment did not reflect in higher net income. That was due to the lower HRSW’s protein content.
- Average (2009-2013) discounts for HRSW, due to lower protein, under the compost treatment were $48.60/ac, $59.20/ac and $43.40/ac for minimum, no-till and conventional tillage, respectively.
Paulo Flores
Nutrient Management Specialist
Manure Spreader Calibration
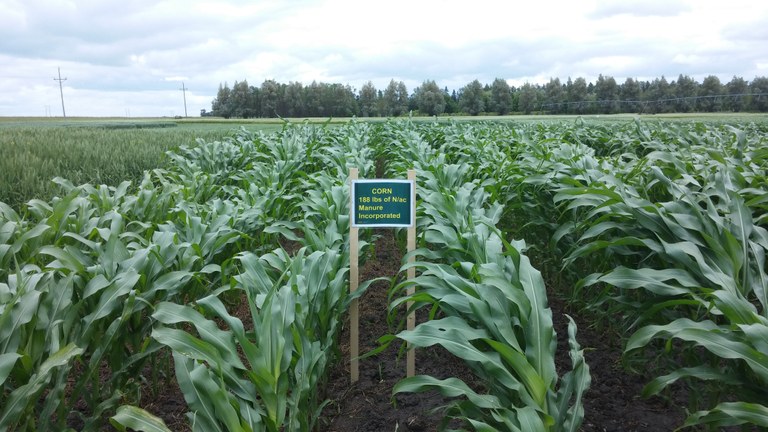
Regardless of the lack of sunshine this summer, crops still grew and producers are working on getting kernels in the bin and bales hauled home before Mother Nature can inflict any(more) damage. Following harvest, it’s time to think about next year’s crops and fertilizer needs. While purchasing a load of commercial fertilizer is the easy option, I challenge you to consider long-term options for your crop and soil needs. Many beneficial and valuable plant nutrients, especially for corn, are contained in fresh livestock manures and compost. Besides the nutrients, using livestock manure or compost will add carbon back to the soil as well as improve water-holding capacity, bulk density and biological properties. I previously shared research using corn and manure on Center Points. That information can be found here: www.tinyurl.com/NDManureFertilizer.
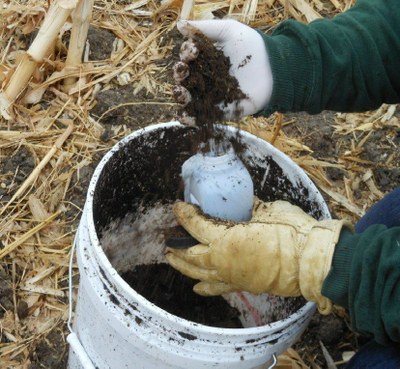 The first step in using manure/compost as fertilizer is to sample it for nutrient content. Sampling technique and area commercial laboratory information can be found here: http://www.ag.ndsu.edu/lem/resources/manure-nutrient-sampling-and-testing. Next, soil testing for nutrients is equally as important as testing manure. Information on soil sampling technique and reading your soil test results can be found in this video: http://tinyurl.com/soiltestingvideo. Having field crop history, manure and soil nutrient test results and future crop information will help you determine the amount of fertilizer (manure, compost and/or commercial) that needs to be applied. Using the 2 new calculators designed specifically for ND corn producers (ND Corn Nitrogen calculator found here: http://www.ndsu.edu/pubweb/soils/corn/ and the ND Manure Corn Nitrogen and Phosphorus calculator found here: http://www.ag.ndsu.edu/lem/manure-corn-n-p-calculator) will offer you some fertilizer guidelines to follow and assure that you are neither under- or over-applying fertilizer. Both can have detrimental effects, be it on the checkbook or environment.
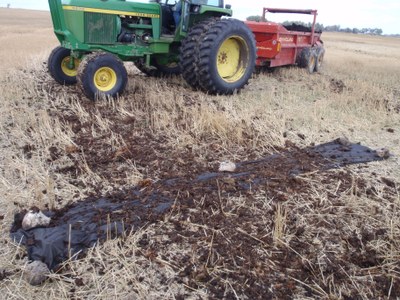
Now that you know how much manure/compost to apply, it is time to calibrate the spreader. Calibrating the manure spreader is a simple process and can be done with items that are most likely already present on the farm. An explanation of 2 manure spreader calibration techniques with easy-to-follow worksheets can be found here: http://tinyurl.com/manurespreadercalibration. The following steps highlight how to calibrate a manure spreader using the sheet method. This method can be done with your personal spreader or a custom spreader.
- Materials:
- Sheet or tarp that measures 21.8 feet2 (you can use any tarp, you just need to know its area (length ft x width ft))
- 5-gallon bucket
- Scale
- Weigh the bucket and sheet to tare the weight of the manure.
- Lay out the sheet and anchor it down with a few rocks or stakes.
- Record your tractor gear, engine’s revolutions per minute (RPM) and spreader settings.
- Apply the manure over the sheet.
- Weigh the manure-covered sheet in the bucket.
- If the tarp measures 21.8 ft2, the weight in pounds of manure on the sheet is equal to tons/acre. If not, simply multiply the bucket weight by 21.8 and divide that by the tarp area in square feet (ft2).
- Do this 3 times or set up 3 separate sheets and use an average of the weights.
I would like to help 5 crop producers and/or custom manure haulers calibrate their manure spreaders this fall. If you would like help calibrating a manure spreader please contact me at 701-652-2951 or mary.berg@ndsu.edu.
Mary Berg
Livestock Environmental Management Specialist
The CREC Agronomy Laboratory
While fall is a particularly busy time in the CREC’s Agronomy Lab, there is plenty of work year-round. In early spring, seed samples begin to arrive. We test the germination on these samples and perform a seed count to determine seeds/pound and package seed into manila coin envelopes for planting. The amount of seed is weighed into these envelopes to achieve targeted plant population based on seed weight, germination and plot size. Most plot sizes are 5 feet by 25 feet. Some are bigger, for example, corn and sunflower plots are 5 feet (2 rows) by 30 feet. Envelopes are labeled with the appropriate plot number and replicate number (four replicates or more) and arranged in order in a tray that sits on the planter. During spring planting, we are often on the planters as it takes many staff members to plant the number of trials that we have. A team member is driving the tractor while another is on the planter with the tray of seed.
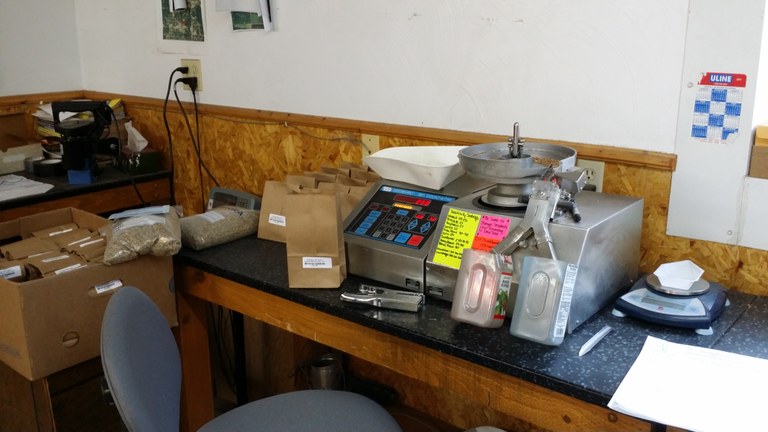
Seed Counter
Right now, we are in the plots with other agronomy staff taking physiological maturity notes and assisting with harvest. The CREC uses plot-size combines with no cab with the exception of the corn and sunflower plot combines. It takes three team members on one harvest crew, with one driving combine, one sitting on a chair on the side of the combine with bags that will collect the seed sample from a particular plot coming out a spout, and one securing the bag with a piece of twine.
Grain Harvester on left and Forage Harvester on right.
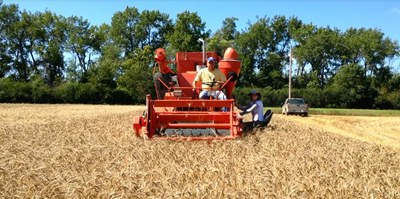
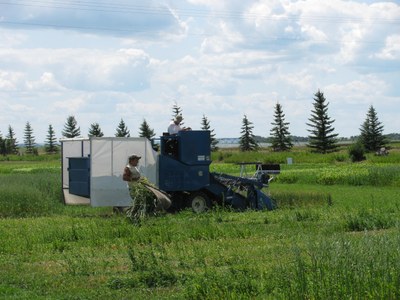
The harvest bags are prepared over the entire summer with a tag and stacked in order according to the plot randomization plan. Once the full bags get back to the lab, we place them in a dryer if they are wet. When dry, we will send them over a grain cleaner. Next we weigh each plot for yield, perform test weight and take a moisture sample. A small (½ cup) sample from each plot is placed in a paper bag to be sent in for either a protein, oil or starch analysis. In particular years, like this year, we will also save a deoxynivalenol (DON) sample, commonly referred to as vomitoxin, to send in for testing from each plot. A kernel weight on each plot is also performed with most of the trials.
We used to record all the measurements by hand and re-key the data, but a couple of years ago we automated the process by connecting data cables from the scales and moisture testers to one central computer with special Collect software. Each bag is tagged with a bar code, so it is scanned then placed on the scale and the yield weight, test weight and moisture automatically fill into an excel file next to the appropriate plot number. The data file is then released to the project leader so they can continue their research, compile results and make recommendations.
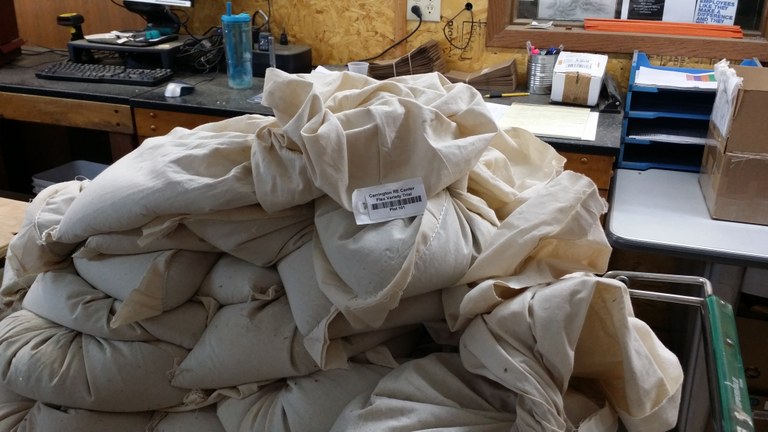
Bar code on harvest collection bag.
After measurements are recorded, most grain is marketed or will go to our livestock unit. Some commodities are donated to food pantries, and local FFA and 4-H students will often ask for samples to clean for show.
So what is the timeline for processing all the trials? We start immediately with the first trial coming off the combine which would be a winter cereal trial normally the beginning of August and usually finish in December. We then spend our winter months cleaning our pure seed and performing a germination test on all varieties that we will be placed into the CREC’s variety performance tests. We also spend a great deal of time going through harvest bags once they are empty and removing any remaining seed, chaff, and debris from the bags so they are ready to be reused again when the time comes.
If you’ve been out to the CREC lately, you’ll see construction is progressing nicely for a new Agronomy Lab that will house all of the current lab personnel and functions and also provide office, workspace and laboratory facilities for Pathology and Soil Science. If you are ever passing by, stop in and see us!
Kelly Bjerke
Lab Technician
When to Harvest Apples
Do Apples Need a Frost? CREC ‘Honeycrisp’ harvest (October 1, 2013)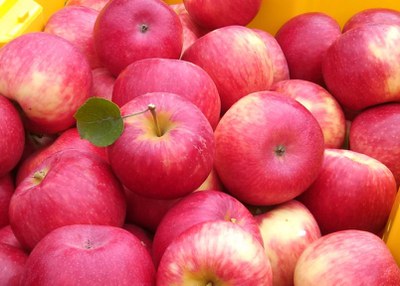
Apples are our largest fruit crop in North Dakota. They bring pleasure to those growing them and bring many, many questions to University, Extension and CREC personnel.
One of the most commonly held beliefs about apples is that they need a frost to become sweet and ripe. This is not true. The warm days and cool nights of fall drive sugar production. Apples can withstand light frosts but a frost is not needed to complete the ripening process.
When temperatures fall below 28 degrees, ice crystals can form within the cells. The amount of damage depends on the temperature and also how long that cold temperature lasts. If the day is cold and cloudy prior to the freeze event, the fruit will freeze faster than if the day had been warm and sunny. If your apples are frozen on the tree, don’t touch them until they thaw. These apples will need to be used promptly.
If you feel your apple variety regularly requires a frost to finish, the tree probably has too long of a growing requirement for our climate. If you eventually replace your tree or add another one, consult nurseries specializing in apples – and especially consider the notes on Minnesota apple varieties.
Maturity vs Ripeness:
- A ‘mature’ apple has reached maximum size, has accumulated all of its starches and can ripen if removed from the tree. It stores the best.
- A ‘ripe’ apple is ready to eat right off the tree. It does not store as long.
Start looking for your first fruit on the southern side of the tree and in the outer branches. Taste the apples: Mature are slightly starchy and crisp while ripe have the great flavor you are looking for. Look at the background color: the skin on the shaded side of the fruit should turn from green to yellow when mature and with varying shades of red when ripe. The seeds of mature and ripe fruit will be dark brown. Pick a few fruits: the stem should break free easily when the fruit is lifted and rotated gently. When fruit starts falling, the apples are ripe and should be harvested immediately.
Sources and Winter Reading:
University of Idaho Extension CIS 1212: When to Harvest Apples
Cass County Extension: Fruit Tree Varieties
Anecdotal stories from an experienced apple orchard: Sponsel’s Minnesota Harvest Apple Orchard
More than any one person can know: www.OrangePippin.com
Kathy Wiederholt
Fruit Project Manager
Crop Yields, Rents and Breakeven Prices for 2014 & 2015
With the recent trend in lower grain prices, being able to take a good look at what the total costs of a particular crop are and how that relates to yield numbers and various land charges, be it land payments or simply cash rent, is of vital interest to today’s producers. Can producers cover the total costs with today’s prices and can they make those crop budgets work with the prices currently being bid for 2015 crop?
Farm data collected within the South Central Region of the North Dakota Farm Business Management Program, showed an 81% increase in total soybean costs per acre, from 2006 to the end of the 2013 crop. This increase in production costs included a surge upwards in cash rents as well as other crop costs.
As producers work with the higher per acre costs of various crops, it is imperative to understand the relationship between costs, levels of production and the land charge or cash rent. If the land involved is owned but has a calculated per acre payment, that amount may be considered in the land charge as it must be covered in one way or another within the cash flow. What is the effect of changing yields and land charges or cash rents? What price levels are attainable and still profitable for the producer?
One other item that must not be overlooked is that high profit producers often raise crops for less total expense than the average and certainly less than the low profit producers. For example, in 2013 high profit soybean fields in the South Central Region generated an average yield of 38.3 bushels for $23.35 less expense than the average fields which produced 32.0 bushels per acre. When compared to the low profit fields, the difference increased to $44.38 per acre while the production declined to only 21.2 bushels per acre. These figures and those for other crops are available for producers on the Farm Business Management website at www.ndfarmmanagement.com.
The tables below show the effect of changing yields and land charges or cash rent levels for barley, canola, corn, HRSW, soybeans and sunflowers. It should be noted that these are true breakeven costs of production as there is no amount set aside for the operator’s labor or management. Normally a charge of $25 to $40 per acre can be expected for labor and management. The expense numbers, such as barley at $252.29 are from the 2013 year and reflect the average costs without any land charge or cash rent.
In the barley table below, with non-land costs of $252.29 and a yield of 75 bushels per acre, a producer would have a breakeven cost of $4.30 with a $70.00 land charge and $4.83 with a land charge of $110.00 per acre. An operator labor & management charge of $25/acre would add an additional $.33 per bushel.
For additional information about the Farm Business Management Program or to enroll your farming operation, you may contact Steve Metzger or Jory Hansen at the CREC at 701-652-2951.
Row Crop Tour Set for Sept. 3 at NDSU Carrington REC
Farmers, crop advisers and agricultural industry representatives are invited to attend a row-crop field tour on Wednesday, Sept. 3, at the Carrington Research Extension Center. The tour will begin at 4:30 p.m. and conclude with a sponsored supper.
Participants will view field research trials and receive production recommendations on corn, dry beans and soybeans. The objective is to concisely discuss as many production subjects and share as much research trial data as possible to give participants information they can utilize for their farms or farm clients.
The tour agenda includes:
- Corn growing season review and plant nutrition
- Dry bean plant establishment
- Soybean variety selection, planting dates and herbicide-resistant kochia management
- Disease management in dry beans and soybeans, with an emphasis on white mold (sclerotinia) and soybean cyst nematode
- Industrial beets project update
Tour speakers include NDSU Extension and research agronomists as well as plant pathologists.
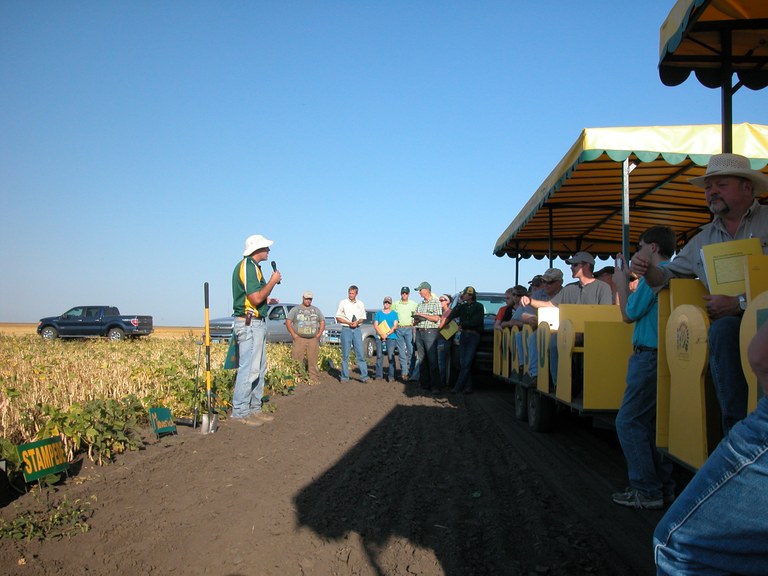
North Dakota commodity organizations associated with the crops covered during the tour will be sponsoring the refreshments and meal.
Continuing education credits will be available for certified crop advisers participating in the event.
Additional information about the tour is available from the Carrington REC at (701) 652-2951 or on the Web at http://www.ag.ndsu.edu/CarringtonREC.
Greg Endres
Area Specialist, Cropping Systems
Application of Potassium (K) Based on %Base Saturation?...Don’t Bank On It.
I have been asked a number of times: what does the value of %base saturation (%BS) mean on soil test reports? And can I apply K to my soil even though the soil test is high but the %BS of K is low?
Base Saturation (%BS): It is the percentage of soil exchange sites (Cation Exchange Capacity or %CEC) occupied by the basic cations Ca2+, K+, Mg2+, and Na+ (calcium, potassium, magnesium, sodium ions) in soil. Base saturation increases with soil pH.

Cation Exchange Capacity (%CEC): A soil’s ability to attract, retain, and supply cations to plants. These cations include the basic cations and acidic cations, aluminum (Al3+) and hydrogen (H+). Other soil cations include micronutrients as well. In soil, the surfaces of the clay minerals and organic matter are surrounded by negatively charged ions. Like a magnet, these negative charges attract positively charged ions (cations) like Ca+, K+, etc., which bind onto the surfaces and prevent nutrients from leaching ( i.e. carried by rainwater moving down into the soil, and away from plant roots). Most of the SOM in soil is within the top 6 inches and retains many of these cations.
Should I apply K to my soil even though the soil test is high but the %BS of K is low?...No.
The %BS concept suggests fertilizer application should be made of a given nutrient, e.g. K, if the soil test ratio of K (meq/100 g) to the sum of positively charged nutrients in the soil exchange site (CEC) is < 5% K. That is, an ideal soil CEC should contain 65% Ca, 10% Mg, and 5% K or a 13:1 Ca:K ratio. There is no justification of this concept which has been refuted time and again since it was suggested in the 1940’s. This concept will tend to overestimate fertilizer needs for North Dakota producers because the agricultural soils here have CEC’s mostly in the 10 -17 meq/100 g range and above (i.e. sandy loam, loam, silt loam, and clay loam soils).
The NDSU fertilizer recommendation is based on the concept of sufficiency level of available nutrient. This means there are optimum levels of a given soil nutrient (or narrow range) above which plants will not respond to fertilizer application. In a wheat field for example, if your K soil test is >100 ppm (200lbs/a) applying K2O will likely be uneconomical. For corn in North Dakota, a soil test above 160 ppm K is very high. Below 160 ppm, modest application of 20 – 30 lbs. K2O may be beneficial especially in cool spring.
Conclusion: In ND, do not make fertilizer application decisions based on the % base saturation.
North Dakota fertilizer recommendation tables accessible at:
http://www.ndsu.edu/fileadmin/soils/pdfs/sf882.pdf
On-going Research
We are evaluating wheat response to K rates of two wheat varieties of high (Sy Soren) and low (Barlow) resistance to lodging. The %BS of K was below 3.4 at both locations, and soil tested in the medium to high range in Carrington and Dazey, ND. Preliminary evaluations show that the variety with less resistance is lodging more following heavy rainfall events and irrespective of amount of K applied at both sites. Biomass dry weight is showing little response to K rates as well.
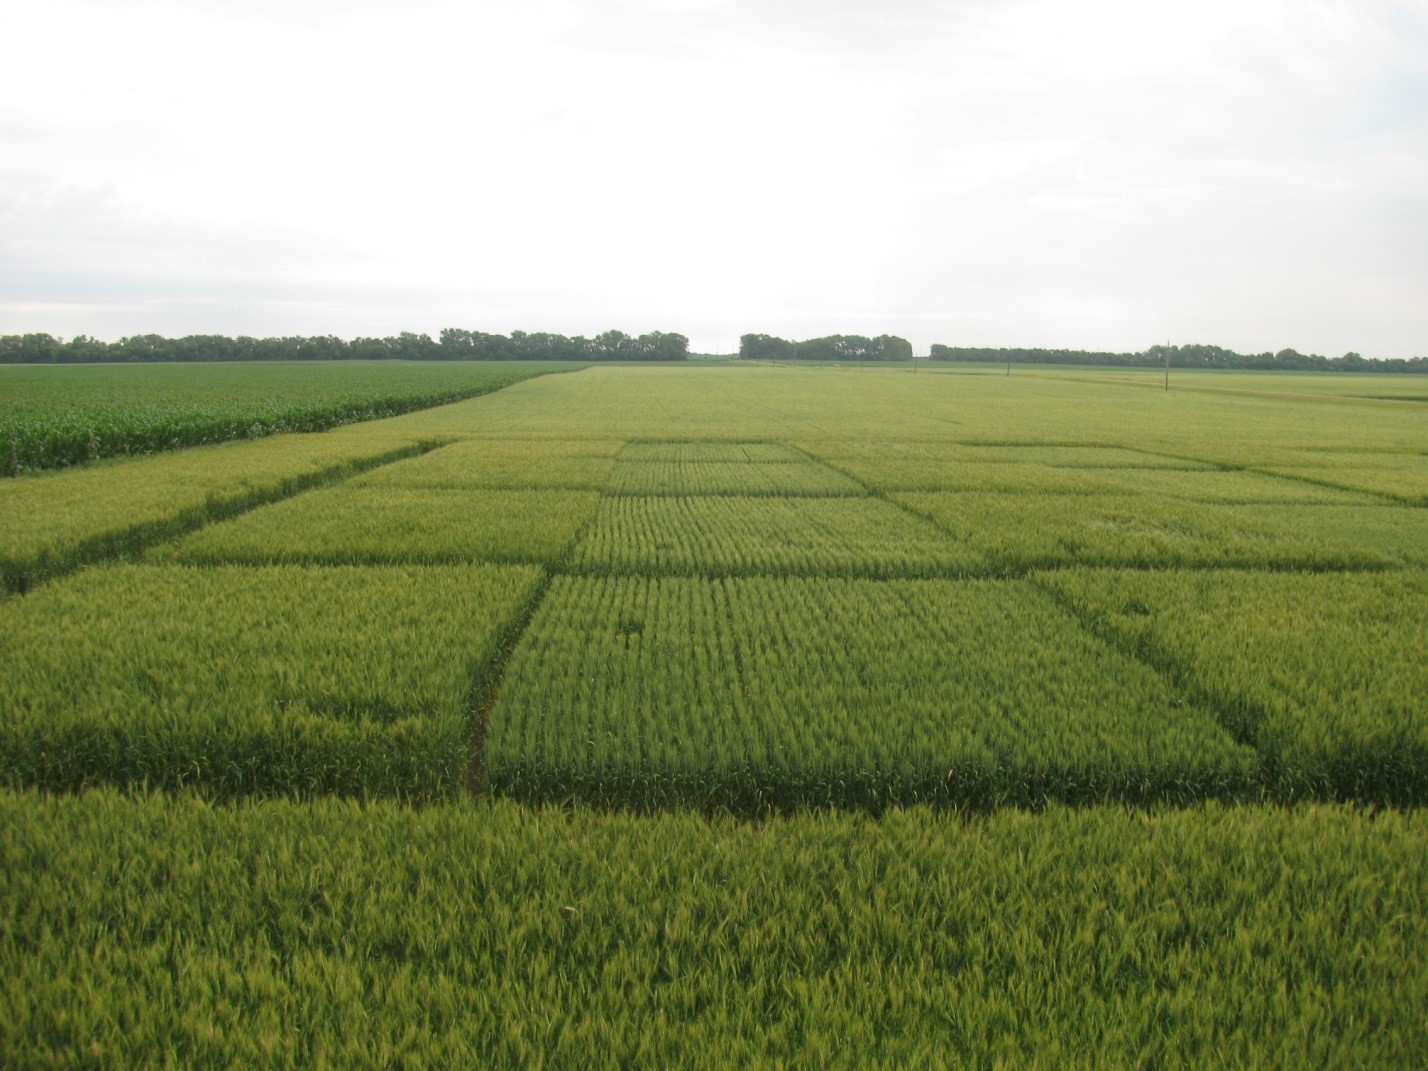
Wheat field (soil test in medium range) in Dazey, ND treated with 0, 25, 50, or 75 lbs. K. No lodging response to K.
Note: Low CEC soils indicate low clay and low OM. You can at least manage your soil OM. To increase CEC, apply manure to raise OM content.
Application of total required K and other fertilizer nutrients to a sandy soil with low CEC entails high risk of nutrient loss. Split application of fertilizer is recommended in these soils.
Jasper.Teboh@ndsu.edu
Soil Scientist
The Value of Solid Beef Feedlot Manure for Corn Production in North Dakota
Paulo Flores, Nutrient Management Specialist at the NDSU Carrington Research Extension Center, developed an Excel spreadsheet (The Value of Solid Beef Feedlot Manure as a Nitrogen or Phosphorus Source for Corn Production in North Dakota; hereafter “Calculator”) that allows farmers to compare the value of solid beef feedlot manure as a source of nitrogen (N) and phosphorus (P) to commercial fertilizers for corn production in North Dakota. Calculations are based on the assumption that the cost per unit of N or P is the same for manure and commercial fertilizer, and that cost is based on the price of the different sources of N and P listed in the spreadsheet.
Information regarding field (area, soil nutrient content), crop (yield potential, nutrient recommendations), commercial fertilizers (price, nutrient content), manure (nutrient content, costs associated with application, availability factors, additional nutrient value) and interactions amongst some of those variables are taken into consideration in the calculations.
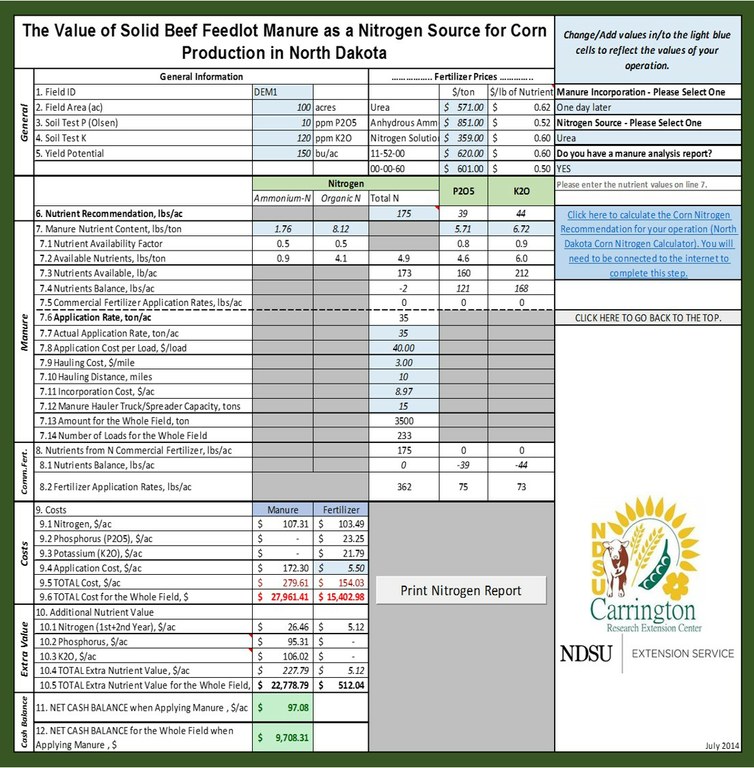
The values in the light blue cells (including the drop-down menu selections – top right corner) are customizable and allow farmers to change those values to reflect the numbers of his/her operation. Once all the light blue cells are filled out, the Calculator will provide a “Net Cash Balance” per acre and for the whole field when using manure instead of commercial fertilizers as a source of N or P for corn in ND. The user can make changes to the values in the light blue cells and/or pick a different option in the drop-down menus at any time. As he/she does that, the Calculator will automatically calculate new values to reflect the changes made. This can be useful for determining the hauling distance limit that allows one to remain profitable when applying manure. Once the values are set, the user can print a copy of the N and/or P report, by clicking on the “Print Report” button built into each spreadsheet, or save the file on his/her computer.
Some things to know about the Calculator
- Please "Enable Active Content" on Microsoft Excel so the calculator can perform as expected.
- On the home screen, the user can select if the manure is going to be applied to meet "Nitrogen Crop Requirements" or "Phosphorus Crop Requirements".
- The Calculator is not intended to calculate N recommendations for corn. Please visit the "North Dakota Corn Nitrogen Calculator" website to find out the N recommendation for your operation.
- The Calculator has an option to perform the calculations using average values for manure nutrient content. Because the amount of nutrients in manure vary greatly, it is strongly recommended that farmers have the manure analyzed.
The Calculator can be downloaded here: https://www.ag.ndsu.edu/lem/manure-corn-n-p-calculator. You will find detailed information about the Calculator on this link as well as in the Excel file.
Comments, questions and/or suggestions are welcomed. Please feel free to contact Paulo at the Carrington REC by phone (701.652.2951) or email (paulo.flores@ndsu.edu).


