Economics of a Long-term Cropping System at the Carrington REC
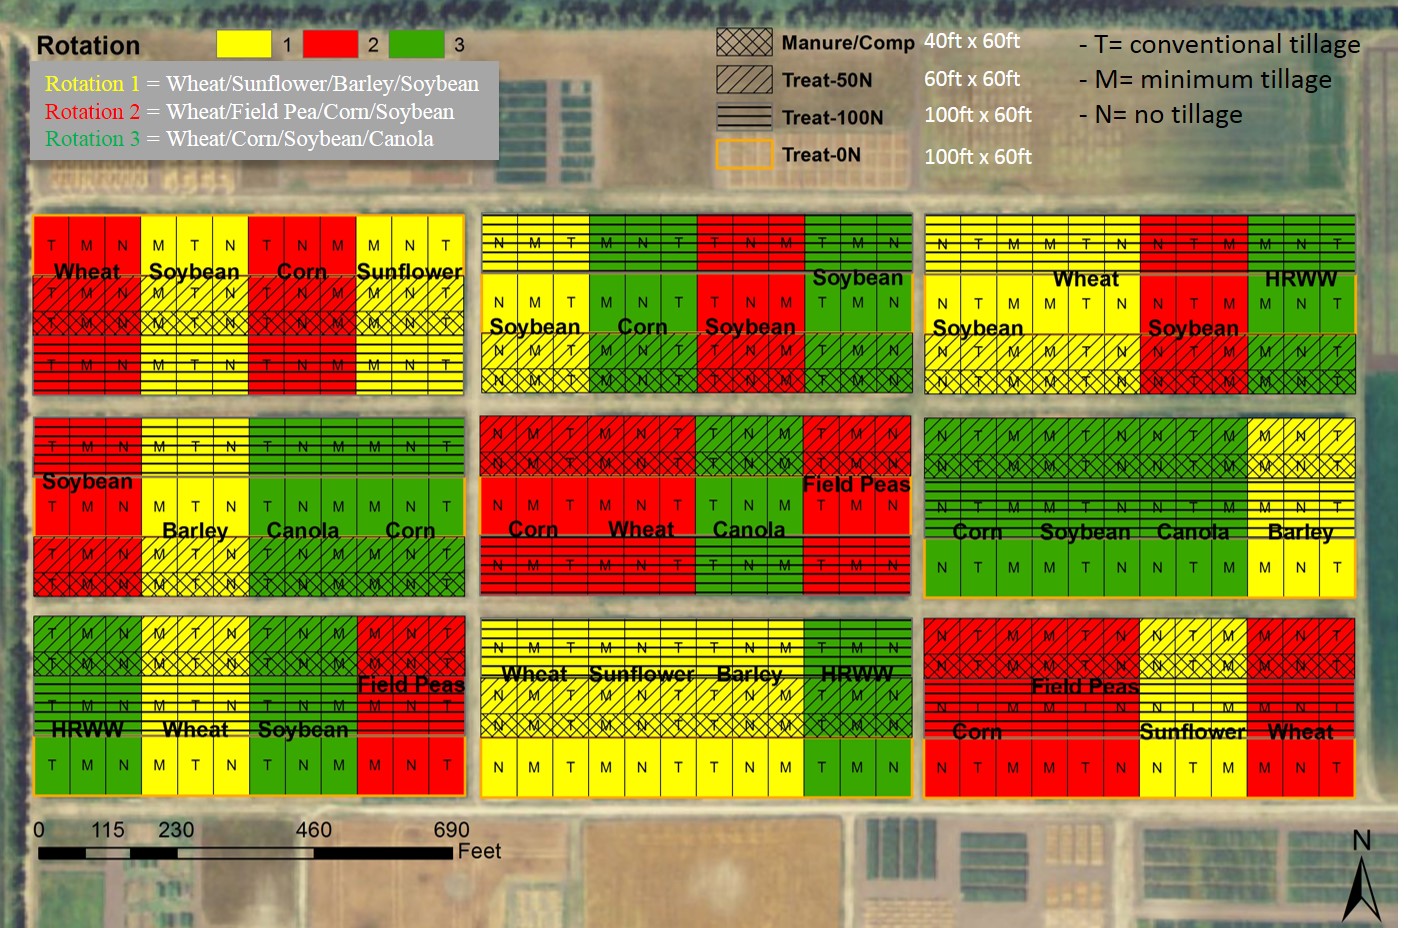
In 1987, a long-term cropping systems study was initiated at the NDSU Carrington Research Extension Center (CREC). The study consists of cycles of three, 4-year crop rotations with three replicates (See figure below). In 2003, at the beginning of the fifth cycle, the base rotation was updated to reflect the changes in crop production that occurred since inception of this study. The seventh cycle began in 2011. The new base rotation is: Hard Red Spring Wheat - Sunflower - Barley - Soybean (Rotation 1). The other two current rotations are Hard Red Spring Wheat - Field Pea - Corn - Soybean (Rotation 2) and Hard Red Winter Wheat - Corn - Soybean - Canola (Rotation 3). The last rotation is also split to include a cover crop vs. no cover crop component between each grain crop. Each crop within each rotation is planted every year.
The goal of the study is to determine the singular or combined effects of crop rotation, tillage system, N fertility levels and sources, on crop grain and biomass production, crop diseases, soil nitrogen, soil phosphorous, soil organic matter, and soil pH.

Tillage treatments (conventional, minimum and no-till) are imposed along the North-South direction, while the fertility treatments (nitrogen rates and sources) are imposed along the East-West direction (pictured above). Urea is used as an N source and it is applied each spring to non-leguminous plots at 0, 50, or 100 lbs. of N/ac, and composted beef feedlot manure is applied once in the spring at a rate of 200 lbs. of N/ac on the first year of each cycle. As seen on the picture above, this arrangement of the treatments yields 12 sub-plots within each crop plot.
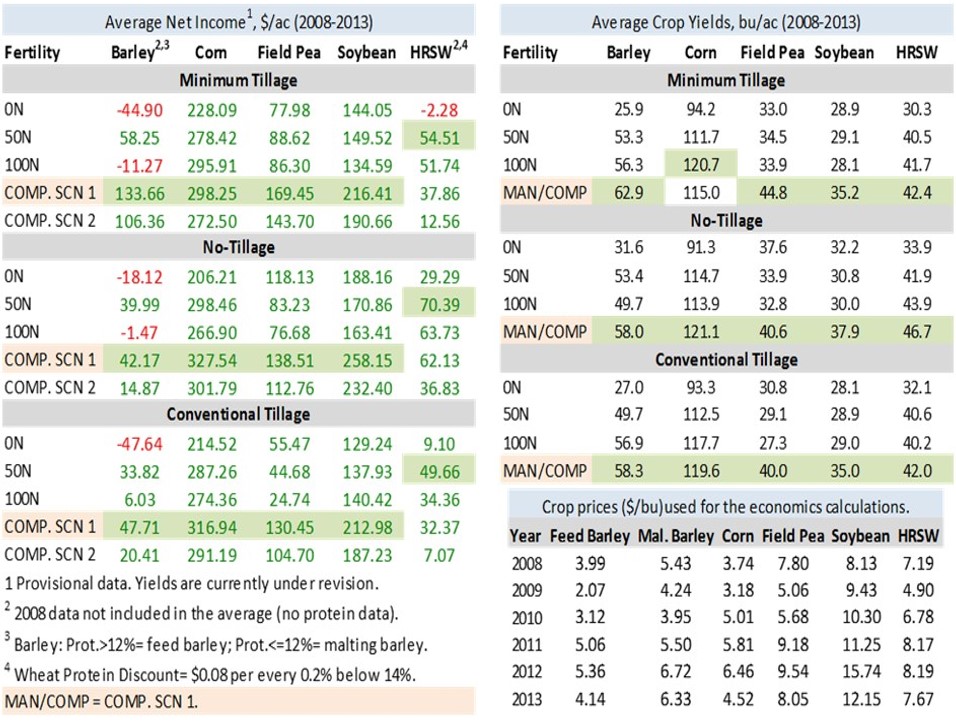
Previous statistical analysis of yield data for this trial showed that tillage and fertility treatments are mains factors affecting crop yields. Earlier this year we decided to look at the economics of some of the crops planted within this long term cropping system. The crops (barley, corn, field peas, soybean and hard red spring wheat (HRSW)) and period of time (from 2008 to 2013) covered on this article were based on the availability of data to compute the production costs (tillage, fertilizer, seeds, chemicals, seeding, combining, overhead and land) and gross return (crops yield and prices). The economics were run based on two scenarios: Scenario 1 (SCN 1) – you own the compost and your only cost would be to haul it; Scenario 2 (SCN 2) – you pay for unit of N in the compost the same price paid per unit of N in commercial fertilizer.

Some notes about the tables above and findings of this study:
- Green and red numbers represent, respectively, positive and negative net income. The higher values for both average net income (left) and average crop yields (right) are highlighted in green.
- As an average of 6 years, the beef feedlot composted manure under scenario 1 (COMP. SCN 1) showed higher net income in all tillage systems for barley, corn, field pea and soybean.
- Under scenario 2 (COMP. SCN 2) that treatment showed to be more profitable in all tillage systems for field pea and soybean.
- The lower net income seen for barley with 100 lbs. N/ac was due to its higher protein content (>12%), which led to a lower price paid for product (feeding barley).
- It seems that there is an interaction between minimum tillage and the 100 lbs. N/ac, where barley protein content was >12% in 4 out of 5 years of data.
- For HRSW, the 50 lbs. N/ac rate showed to be the most profitable treatment in all tillage systems.
- As an average of 6 years, with the exception of corn under minimum tillage, the beef feedlot composted manure treatment out yielded the other treatments by at least 2 bu/ac for all the crops listed on the table above.
- The higher HRSW yields seen on the manure treatment did not reflect in higher net income. That was due to the lower HRSW’s protein content.
- Average (2009-2013) discounts for HRSW, due to lower protein, under the compost treatment were $48.60/ac, $59.20/ac and $43.40/ac for minimum, no-till and conventional tillage, respectively.
Paulo Flores
Nutrient Management Specialist


