

Center Points
Interseeding Legumes with Hard Red Spring Wheat
The concept of seeding legumes with HRSW is not new; our ancestors seeded sweet clover or possibly alfalfa with cereal grains prior to the widespread adoption of commercial fertilizer. Interest in reducing fertilizer inputs has increased greatly in the past few years.
What is new, however, is the myriad of legume options at our disposal. We screened literature and talked to producers to determine legume species with a potential fit in our cropping systems. We included sweet clover in this study as a legume check, based on previous research in the region.
HRSW and the companion legume were seeded in May 3, 2019 into a moist seedbed at a depth of about ¾ of an inch. The 2019 growing season had a dry spring with little significant rainfall after seeding and below normal precipitation for the entire growing season. Rain finally arrived at harvest. This preliminary data below shows the companion legume treatments with no definitive results at this time. At least four years’ data will be needed to produce reliable, repeatable results that may become recommended practices.
We will also plant a test crop without fertilizer the following year to determine if there is an impact from the residual effects of growing the legumes.
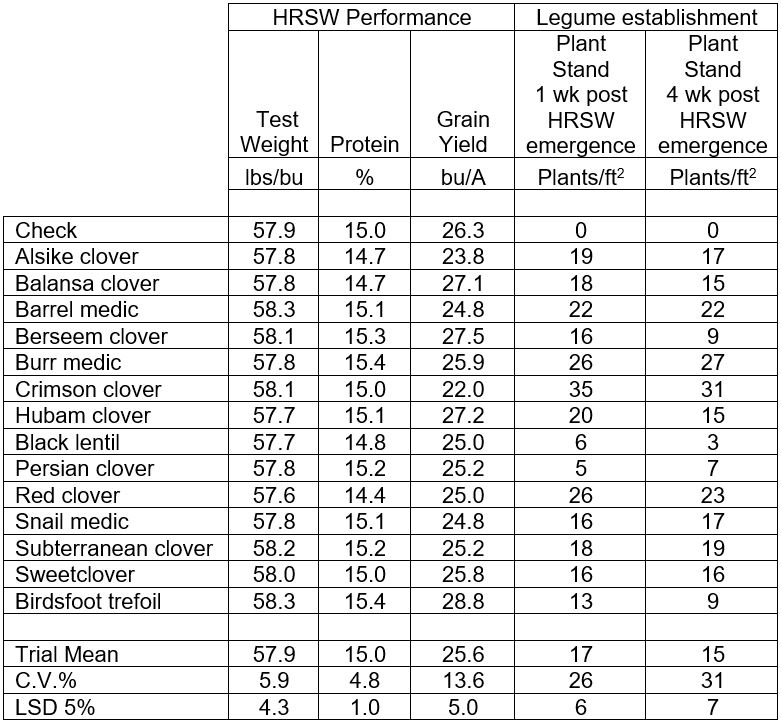
If there is enough biomass produced, the legume crop may be grazed or baled. Even if interseeding doesn’t improve yields, the practice may potentially improve soil health in the long run.
Ezra Aberle
Ezra.Aberle@ndsu.edu
Agronomy Research Specialist
Moldy Cattle Feed
How much mold is too much when feeding beef cattle? The goal is to feed very little mold but sometimes that’s an unrealistic expectation in the ranching business. The two most common sources of mold for cattle are hay and silage.
It is extremely difficult to make hay in high rainfall regions without some mold. Untimely rains allow for mold growth in the windrow before baling and when hay is baled too wet, the molds will grow inside the round bale. Looks are deceiving since the hay bales can look fine on the outside but are moldy on the inside. If bales are ground or shredded, we never see the mold in the hay bale other than an abnormal dust cloud.
Corn silage that isn’t covered with plastic will develop several layers of mold. The top, black mold layer is decomposed feed. It has lost most of its feed value and should be discarded and not fed. The next mold layer is white and shows the transition between the non-fermented and fermented silage pile. Usually the white mold layer is drier than the fermented part of the silage pile since it lost moisture due to exposure to sun and wind.
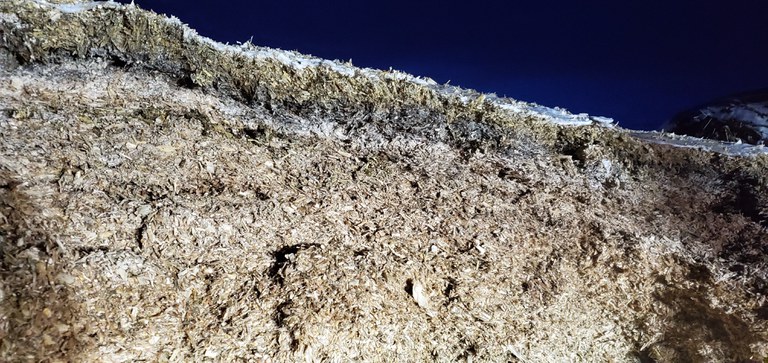
Corn silage with two layers of mold, black and white.
With the ongoing, late corn harvest in eastern North Dakota, molds are being seen on wet, light test weight corn. An NDSU Extension resource on moldy corn can be found here: https://www.ag.ndsu.edu/publications/crops/corn-ear-molds-basic-questions-and-answers/pp1451.pdf.
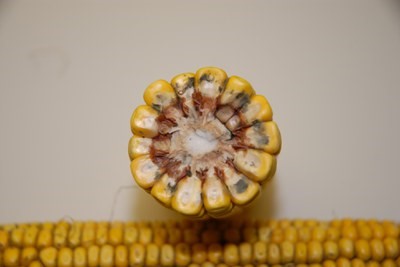
Molds on ear corn may contain mycotoxins.
Experience indicates that beef cattle can consume some mold without too many problems. However, when sporadic abortions occur in a cow herd, mold or fungal abortions are incriminated. Testing for abortions caused by mycotoxins (toxins caused by molds) at the NDSU Veterinary Diagnostic Laboratory (VDL) should include both the fetus and the placenta.
If you suspect molds are present in your stored feeds, you are encouraged to contact your local NDSU Extension agent (directory). There is an ongoing effort to collect samples of moldy, stored feeds which will help develop a stored feed research testing procedure and program at the NDSU VDL.
Karl Hoppe, Ph. D.
Karl.Hoppe@ndsu.edu
Extension Specialist - Livestock Systems
Composting Youngstock Mortalities
Livestock mortalities are an inevitable part of all livestock operations. Rendering, incineration, burial and composting are approved methods of carcass disposal in North Dakota. Though dragging a carcass off to the section line has been a historical practice, abandonment is not recommended and is likely illegal in your state. Abandonment promotes extreme biological and disease hazard, threats to water quality, odors, flies, scavengers, rodents and visual pollution. Livestock mortalities are composted at the NDSU Carrington Research Extension Center.
Composting is a naturally occurring process that breaks the carcass into basic elements via microorganisms and heat generated during composting. Composting is a simple process that requires few materials and minimal maintenance.
Following are some tips on how to build a successful mortality compost pile or windrow:
- If composting one animal, build a pile.
- If composting several animals, build a windrow.
- If the carcasses are from smaller livestock or newborn animals, they can be layered as shown in the diagram below.
- You’ll need base material such as straw or old hay, bulking material such as manure or spoiled silage, and cover material such as straw, old hay or sawdust.
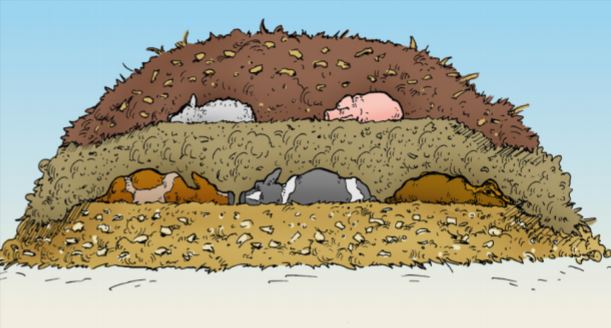
Diagram from the Cornell Waste Management Institute showing how to layer small livestock mortalities in a compost pile.
Use this process for composting:
- Start with 2 feet of base material in a windrow or circle, depending on how many carcasses will be composted.
- Lay the carcass on top of the base. Have at least 1 foot of base material between the perimeter of the carcass and the edge of the base.
- Cover the carcass with 8 to 10 inches of bulking material.
- Cover the entire pile or windrow with 2 feet of cover material. The cover material should be placed on the top and sides, with no part of the carcass showing. The pile needs a good cap to keep predators out and seal in heat.
To maintain the compost site:
- Leave the pile or windrow undisturbed to keep heat sealed in during the very cold winter months.
- To accelerate the process, aerate the pile every two months using a loader from early spring until late fall.
- Make sure sufficient cover material always is present.
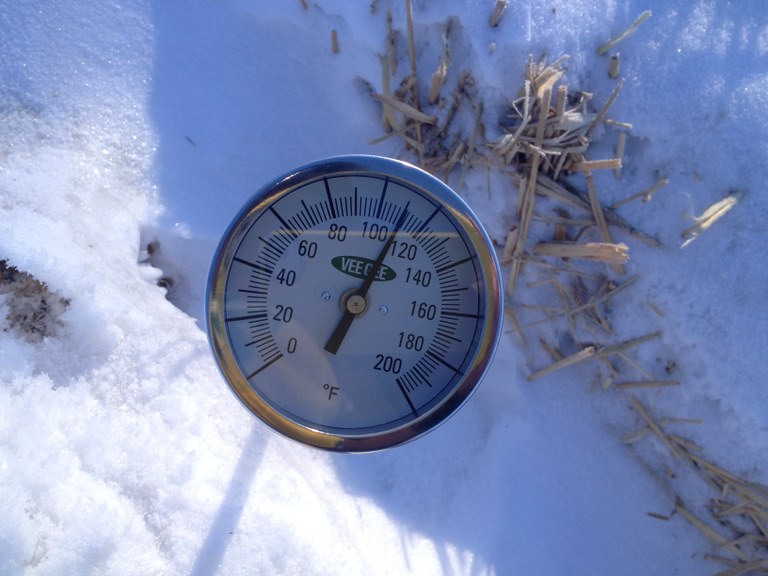 Internal temperature of a winter livestock mortality compost pile in North Dakota.
For more information:
- Check out this link to the Livestock and Poultry Environmental Learning Community. You will find archived webinars pertaining to various components of mortality management: https://lpelc.org/mortalities/
- View the NDSU Extension publication 5 Easy Steps for Composting Dead Livestock: https://www.ag.ndsu.edu/publications/livestock/5-easy-steps-for-composting-dead-livestock
- See NDSU Extension’s “Animal Carcass Disposal Options” publication https://www.ag.ndsu.edu/publications/environment-natural-resources/animal-carcass-disposal-options-rendering-incineration-burial-composting.
Interested in composting your livestock mortalities during calving or lambing this year? Contact you local Extension agent or Mary.Keena@ndsu.edu (701-652-2951) for on-farm assistance.
Mary Keena
Mary.Keena@ndsu.edu
Extension Specialist, Livestock Environmental Management
Leapin’ Lizards! February 29
We were talking in the break room a couple of weeks ago about Julian days (yes, some days the conversation is a little more scientific than others). How does that extra day factor into scientific calculations?
Our research staff use Julian days as a concise way to record what happens and when. We use calendars with both the calendar date (February 24) and the Julian date (55) as a reference when taking field notes.
If you’re curious, you can read about calendars and all the planning that went to establishing them here. There’s even more about leap years here.
For example, if a field pea variety was planted May 6, Julian day 126, and flowered on June 29, Julian day 180, how many days from planting to flowering did it take? We can use Julian days to easily calculate the number of days, 180-126=54 days from planting to flowering. We can continue to record numerous phenological events using these numbers. If the same variety of peas quit flowering on Julian day 193 we can determine the number of days the pea variety flowered, 193-180=13-day bloom duration. We can go one step further to quantify maturity of the pea variety. We record the variety reached PM (maturity) on July 30, Julian day 211, so it would have taken 85 days from planting to maturity. I think you get the point, using a Julian day calendar assists researchers in recording crop growth events along with using these numbers for data analysis to put them in table form for you to use to make your crop variety choices.
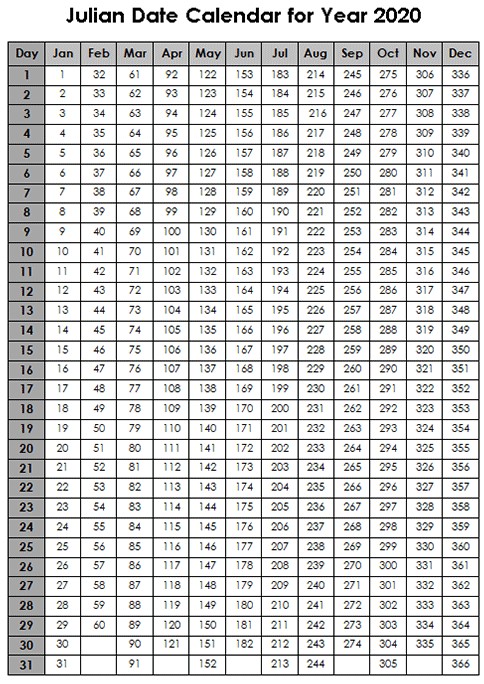
2020 Julian date calendar.
A better measure of how much time crops (corn, sunflower, or wheat for example) need to grow is determined by using Growing Degree Days, but that’s a topic for another Center Points.
What’s the point? It’s easier to count days to maturity, for instance, by adding the days to maturity to the planting day number, then convert back to a calendar day. You could recite “thirty days hath September” rhyme, or count the bumps on your knuckles, and then add in the extra days in the first and last months, but a quick glance at the Julian Date might be less frustrating.
Does Leap Year negatively impact scientific calculations? Not when Julian Dates are used to count the span of dates. It’s a good thing, too, that February 29 is well outside our growing season (unless you are growing some of that 300-day corn) in North Dakota.
Linda Schuster
Linda.Schuster@ndsu.edu
Administrative Secretary
Steve Zwinger
Steve.Zwinger@ndsu.edu
Research Specialist
Influence of Harvest Management Strategies on Flax Yield and Quality
The practice of harvesting a crop of flax has evolved over the years as both equipment and technologies change. Traditionally, flax would be swathed into a windrow to promote plant dry down with threshing by the combine to follow. Now, most flax acres are direct-harvested, often after application of a desiccant to speed up dry down of both the flax plants and any weeds present. Producers initiate a flax harvest operation once the plant has reached physiological maturity (PM). At PM, the optimum flax seed yield, oil content and oil quality should be achieved. PM in flax is defined as when 75% of the seed bolls have reached a brown color. This determination of brown is often not a clear or straightforward assessment since flax bolls will express wide variations of this color as the plant matures.
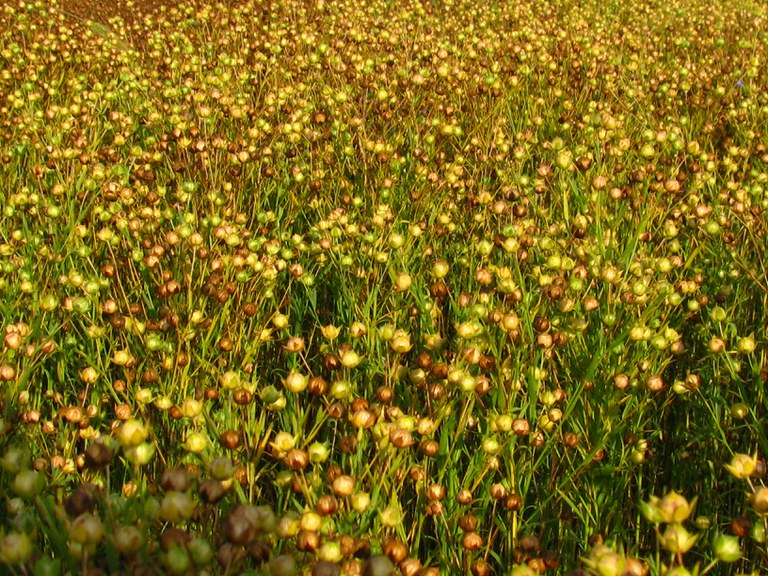 Flax approaching maturity showing variations of boll color change.
The procedures a producer follows when harvesting flax are influenced by weed infestations, uneven stand, available labor and pending weather conditions. These factors, along with the challenges of assessing the 75% brown boll stage, may result in windrowing or applying a desiccant prior to actual physiological maturity. In theory, terminating flax before PM would cause reduced seed yield and oil content or quality would likely be impacted. This effect may be most significant when using a fast-acting desiccant versus one that results in slower rates of plant dry down. When slightly immature flax is swathed and laid in a windrow, we expect some degree of continued maturation as long as temperatures are moderate. Likewise, we would expect a slow acting desiccant to allow some degree of continued maturation for a limited time.
Flax processors and end-users have observed moderate variations in oil content and oil quality (i.e. ALA, alpha-linolenic acid) over the years. Minimal explanations exist as to why these variances occur. Our hypothesis was that harvest management might play a role in influencing flax oil content and quality.
Field trials were conducted at the NDSU Carrington Research Extension Center from 2017 to 2019 to determine how the different harvest approaches used by farmers may affect seed yield and oil content and quality. Objectives of the trial were to: 1) Compare windrowing and desiccation to natural plant dry down. 2) Determine if harvest at a stage prior to assessed PM influenced seed yield, oil content and quality. 3) Assess multiple herbicide desiccants to determine effective rate of plant dry down and influence on yield and oil.
Windrowing and desiccant application were initiated at 50% and 75% brown boll color representing two stages of maturity. Three herbicide desiccants were evaluated at each maturity stage including glyphosate and flumioxazin, which are both registered, and one product where a label is being pursued. A control treatment where flax dried down naturally to harvest moisture was established to allow comparison to harvest management strategies.
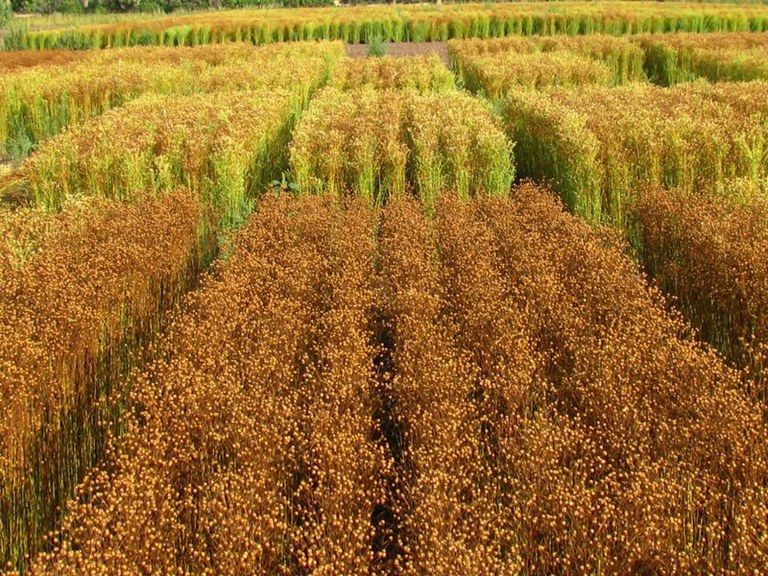
The foreground demonstrates increased rate of flax plant drydown in response to application of a desiccant.
Trial results indicate that defining when flax is mature is very important to optimize seed yield when choosing among desiccants. However, oil content and oil quality were minimally effected by harvest timing or the desiccant used. Glyphosate and flumioxazin are slower-acting desiccants that allowed for a more gradual plant dry down resulting in similar seed yield when applied at either harvest timing and when compared to the control treatment. However, the other desiccant evaluated is a fast-acting product that reduced seed yield significantly across both harvest timings suggesting that at 75% brown boll stage, complete dry matter deposition had not occurred.
Based on this study the variations in oil and alpha-linolenic acid content in flax that are observed by end-users in the marketplace are not likely due to the timing a producer initiates harvest nor the desiccant they may have used. However, the potential for producers to use a fast-acting desiccant in the future will require greater attention to the crop stage when the product is applied to prevent reductions in seed yield. Further research to define flax boll color characteristics that correlate with optimized seed yield will be needed to effectively use a fast-acting desiccant.
Blaine G. Schatz
Blaine.Schatz@ndsu.edu
Director and Agronomist
Variety Trial Tips
Cooperatively, one of the most important annual releases of information from the NDSU Ag Experiment Station and NDSU Extension is our variety trial results. The underlying trials represent a large scope of coordinated activity across the state to assist crop producers in making the best varietal decisions for their operation, from large commodity crops to specialty crops. Sometimes the amount of information provided in the variety testing reports can be overwhelming. Here are some ways to maximize the value of the reports:
Mean data: the first thing everyone looks to is yield. It can be time consuming to, for instance, locate the top 5 performing varieties at a location. One place to start is to look for the ‘mean’ (aka average) value at the bottom of the tables. This is an important benchmark because it is easy to then identify which varieties were better or worse than the mean.
Table 1. Example results from a variety trial.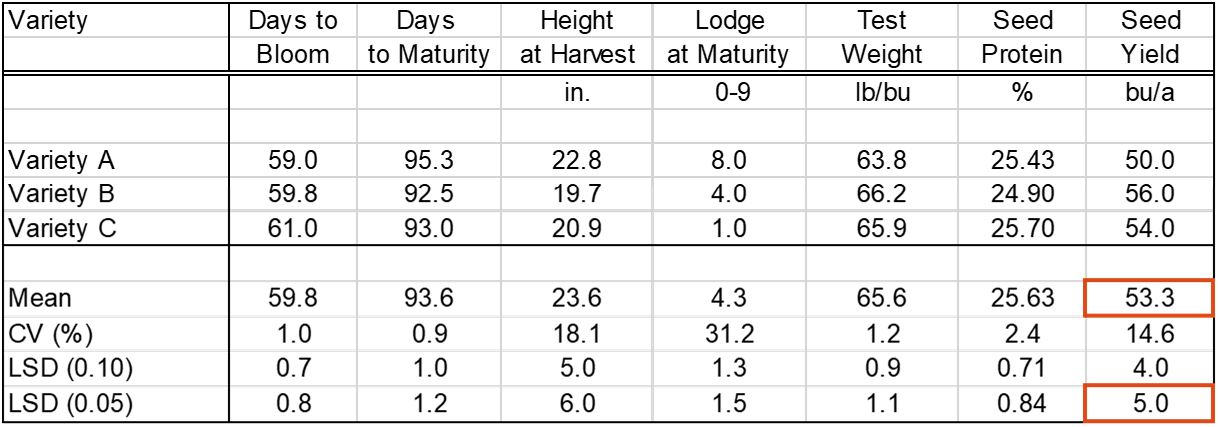
LSD (Least Significant Difference): The tables contain another value at the bottom labeled LSD (0.10 or 0.05). Without going into too much detail, this is a scientific value that indicates the potential range of variability within a trial. In other words, if the LSD (0.05) value is 5 bu/a, it indicates that every instance of a particular variety had a 95% chance of being within 5 bu of its mean. So, if variety A had a yield of 50 bu/a and variety B was 56 bu/a (LSD 0.05), we could say that 95% of time variety B is going to yield greater than variety A. Now what happens when variety C yields 54 bu/a? In this case, we would say that variety C and A are similar (since they are less than 5 bu/a different) because variety A could potentially yield more than variety C at that location at times.
Mean plus LSD: A statistician may chastise the next trick but to quickly find the top performers, you could use a combination of the first two strategies. You can add the LSD value to the mean value. In most trials, there are only a few entries higher than that combined value. You could say that these varieties would be substantially better than the average variety in the trial.
Other factors: We collect data on many other plant characteristics which are often not available from other entities that do variety testing. These may include things like plant height, maturity date, harvest moisture, and lodging. It is more difficult to calculate the direct value/cost of these variables to your operation, but they exist none-the-less. The most important information from these factors might be the outliers. There can be up to 2 weeks difference in maturity between varieties of many crops, or standability differences that affect harvest speed.
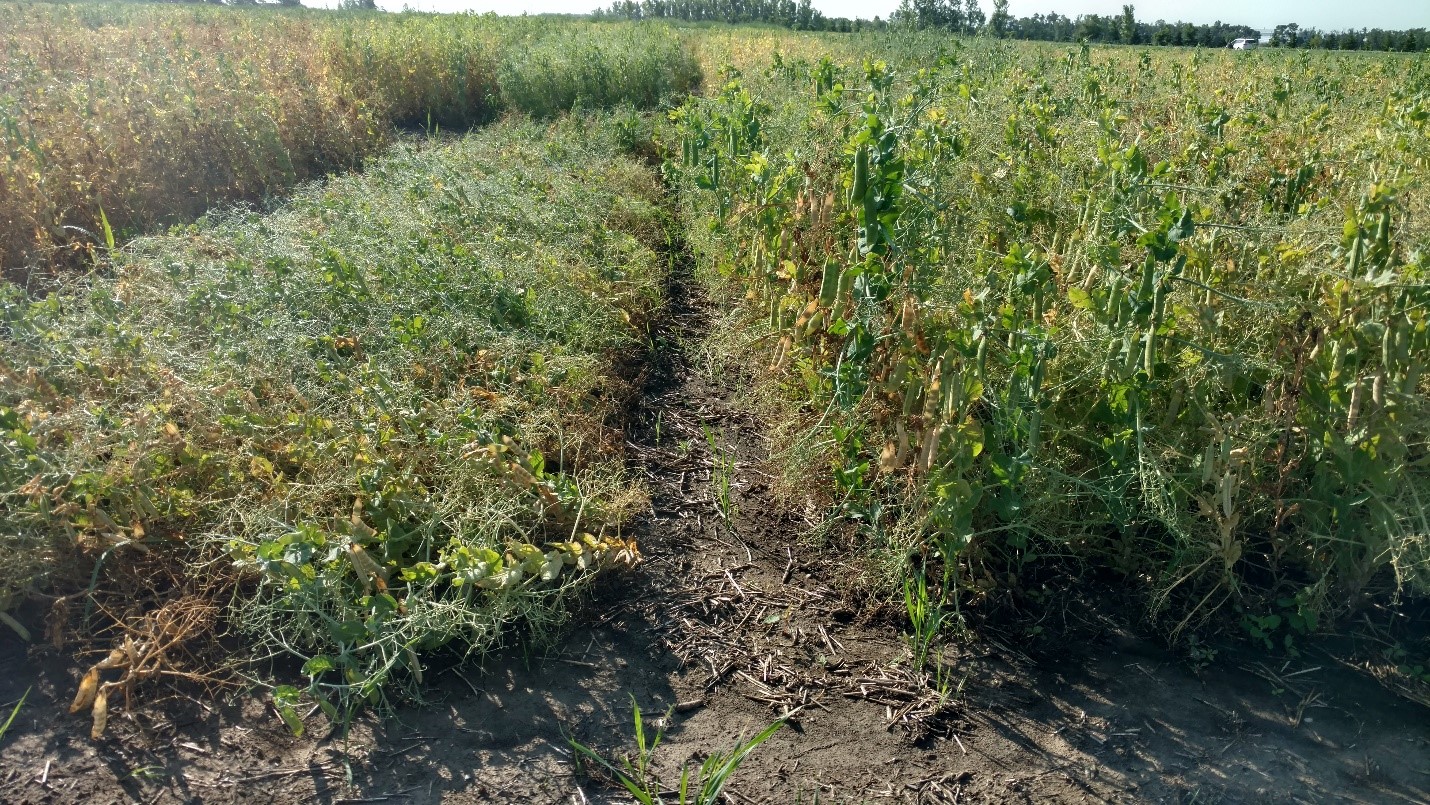 Figure 1. Heavily lodged field peas on the left (rating of 8, Variety A) and good standing peas on the right (rating of 1, Variety C).
You can find the Variety Trial data here: https://www.ag.ndsu.edu/CarringtonREC/crec-variety-trial-data. For more on stats you can read our earlier post titled “Stats for the Rest of Us…How to Read Your Annual Report”.
P.S. If you didn’t see your favorite variety in our trials, talk to your local seed representative and encourage them to submit it to our trials. Our variety trial invitations will be going out soon.
Mike Ostlie, Ph. D.
Mike.Ostlie@ndsu.edu
Research Agronomist
Hot Off The Press!
It’s here! Hot off the press and ready for reading, Volume 60 of the NDSU Carrington Research Extension Center’s (CREC) Annual Report is packed full of information for you. Each year, 300+ research trials along with several tours and demonstrations are conducted at the CREC. You can find a pdf version of the report here: https://www.ag.ndsu.edu/CarringtonREC/news/2019-crec-annual-report-of-research-and-extension. If you prefer a hard-copy please let us know and we’ll get you one.
While all of the activities we do are not covered in this report there is something for everyone. Following you will find a few quick links to get you started. Please note the index on page one which will lead you to specific reports.
- Livestock
- Expanded bunk management and distillers grains research that will aide in understanding the links between feedlot management, distiller’s grains inclusion, and incidence of Polioencephalomalacia (PEM) in feedlot cattle.
- Find related report on page 33 or here: https://www.ag.ndsu.edu/CarringtonREC/documents/livestockrd/2019-docs/impacts-of-inclusion-of-either-25-or-50.pdf/view.
- Mid-winter pen cleaning on feedlot performance and carcass characteristics of steers.
- Find the report on page 30 or here: https://www.ag.ndsu.edu/CarringtonREC/documents/livestockrd/2019-docs/effects-of-pen-cleaning-on-feedlot-performance-and.pdf/view.
- Expanded bunk management and distillers grains research that will aide in understanding the links between feedlot management, distiller’s grains inclusion, and incidence of Polioencephalomalacia (PEM) in feedlot cattle.
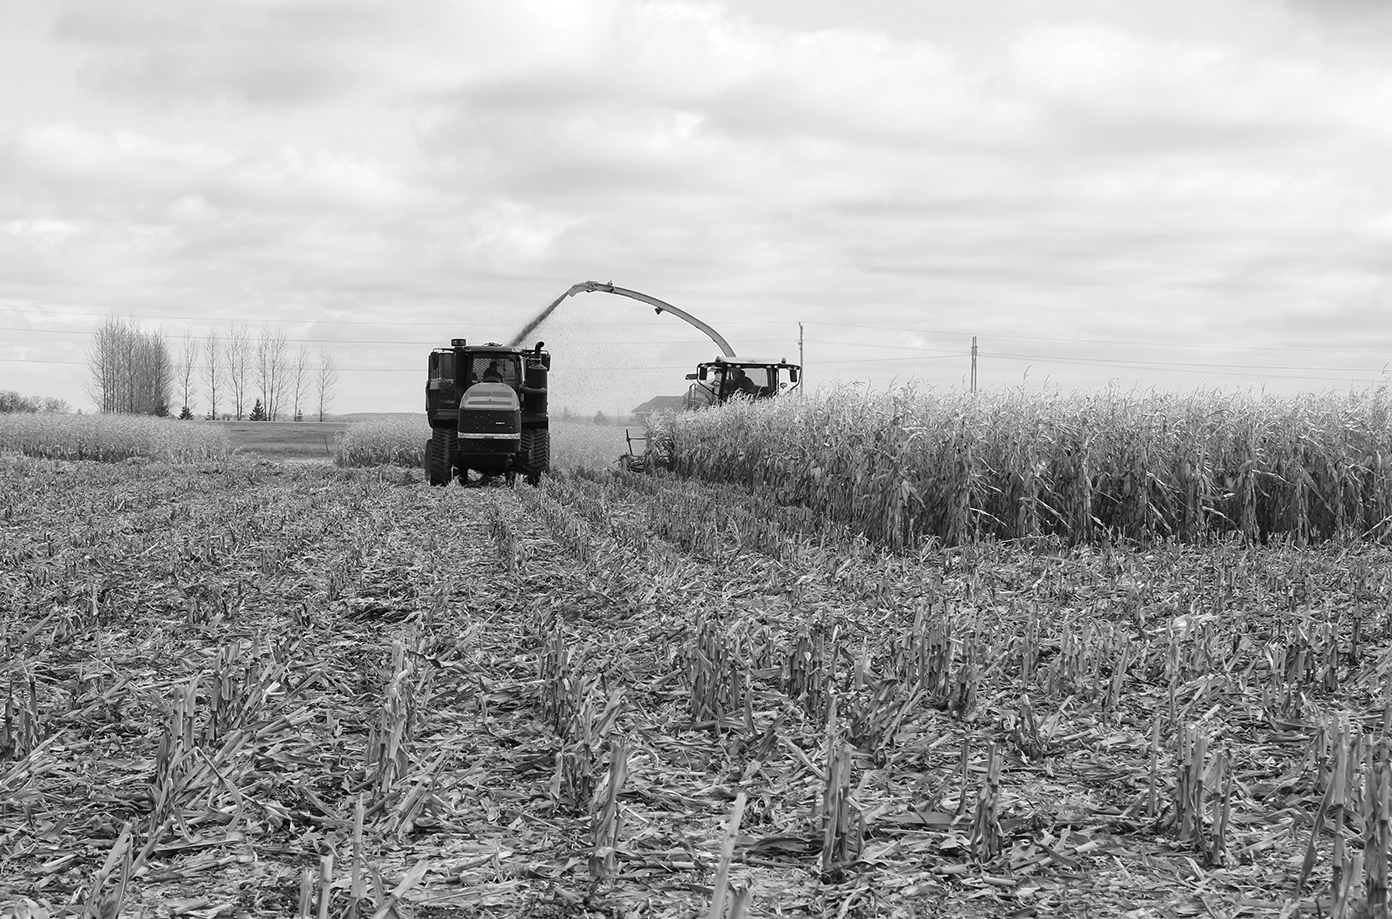
Chopping corn at the CREC, 2019.
- Northern Hardy Fruit Project
- The fruit and berry project continues to serve a broadened constituency as rural and urban homeowners alike contact the Center’s project leader for information on fruit production and related horticultural issues.
- Find related report on page 27 or here: https://www.ag.ndsu.edu/CarringtonREC/northern-hardy-fruit-evaluation-project/fruit-project-results.
- The fruit and berry project continues to serve a broadened constituency as rural and urban homeowners alike contact the Center’s project leader for information on fruit production and related horticultural issues.
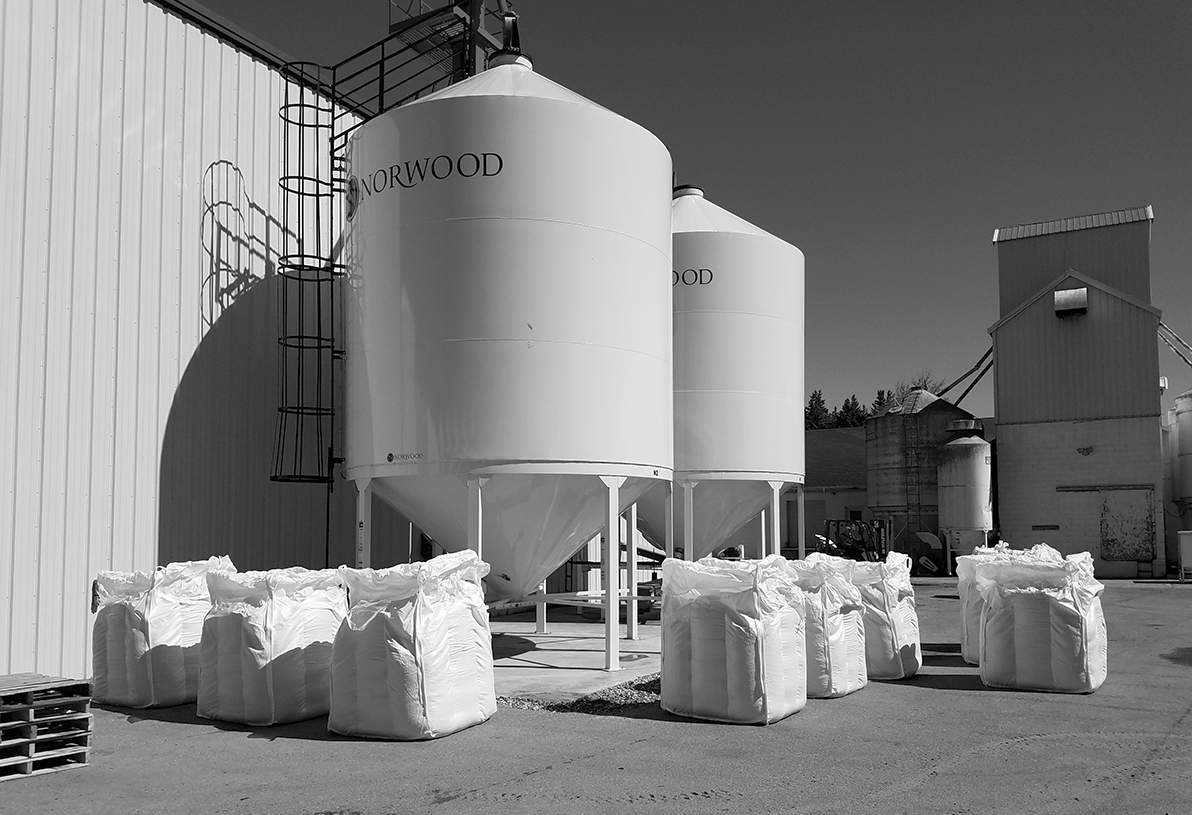
Foundation seed ready for load out.
- Agronomy
- Intercropping studies were conducted for pea/canola, flax/chickpea, and corn silage companions as a way to increase net productivity per acre. In each case, treatment combinations were discovered that result in total yields higher than a single crop.
- Find the report on page 25 or here: https://www.ag.ndsu.edu/CarringtonREC/documents/agronomyrd/docs-2019/corn-silage-intercropping-summary.pdf/view.
- Fertility studies confirmed that planting date is more important to soybean yields than phosphorus fertilization in North Dakota, with the highest probability of producing greater yields from early planting (first two weeks in May) than the following two weeks (when majority farmers are able to plant), or in June, when yields are the lowest. There was not convincing evidence of yield improvement from phosphorus application when planting was in early spring than later.
- A new winter rye variety, ND Gardner, was released by the NDSU Agricultural Experiment Station in 2019. This variety was developed at the CREC and is intended to be used mainly for the rapidly growing cover crop market.
- Find more information here: https://www.ag.ndsu.edu/CarringtonREC/center-points/nd-gardner-winter-rye-a-new-release.
- An NDSU Extension publication was written in 2019 that provides a summary of black and navy bean response to row spacing and plant population from trials conducted from 2014 through 2018.
- Intercropping studies were conducted for pea/canola, flax/chickpea, and corn silage companions as a way to increase net productivity per acre. In each case, treatment combinations were discovered that result in total yields higher than a single crop.
There are many reports not listed above so make sure you check out the entire publication. A listing of Agronomic Research Trials starts on page 41 and Crop Variety Comparison Data starts on page 50. Didn’t find something you were specifically looking for? Let us know by emailing NDSU.Carrington.REC1@ndsu.edu or calling 701-652-2951. - CREC Staff
Observations of Sulfur and Nitrogen Fertilizer Effects on Corn and Wheat Yields in North Dakota and Northwestern Minnesota
Wheat
- Out of 18 site-years in North Dakota and NW Minnesota, sulfur (S) fertilizer improved wheat yields at 5 out of 19-site years. Sulfur improved yields by 4 to 7 bushels/ac at those five sites.
- Nitrogen fertilizer consistently improved yields. However, when N in soil was too low or too high, sulfur did not significantly affect yields. Sulfur had the most effects on yield when an adequate rate of nitrogen (N) was applied.
- An economic analysis of the wheat results suggested that the range of N fertilizer rates that would result in a profit is very narrow; implying that very careful N management planning is key to ensuring optimum fertilizer use, and minimizing profit loss.
Corn
- Out of 12 site years (all loam soils), S significantly improved corn yields by up to 30 bushels in southeast ND (at Forman and Oakes), but had very little impact on yields in the Carrington area. Yields were not affected by sulfur at 7 sites in 2019.
- In site years that were responsive to sulfur, it was estimated based on the nitrogen response yield curve, that the amount of nitrogen required to maximize yields was lowest when 10 lbs of sulfur was applied (Table 1).
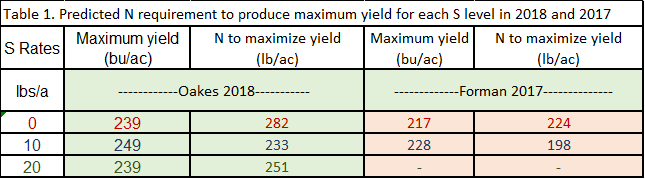
Conclusions
- Application of S at 10 lbs/ac produced the highest yields for both wheat and corn, compared to 0 or 20 lbs.
- Even though 10 lbs of S was enough to maximize wheat and corn yields, under conditions of high S leaching (sandy soils) or prolonged wetness, up to 15 lbs may be applied.
- Including S in fertilizer planning to avoid S deficiency is more efficient and less costly than correcting S deficiency.
- Application of ammonium sulfate and other sulfate forms of fertilizers (potassium thiosulfate, gypsum, etc.) are recommended over straight (elemental) sulfur.
Jasper M. Teboh, Ph. D.
Jasper.Teboh@ndsu.edu
Soil Scientist
Dry Bean Production Update and Workshop
This blog post will provide an overview of two Carrington Research Extension Center (CREC) pinto bean production management studies, plus announce dry bean educational workshops scheduled later this month. The studies and workshops are being supported by Northarvest Bean Growers Association.
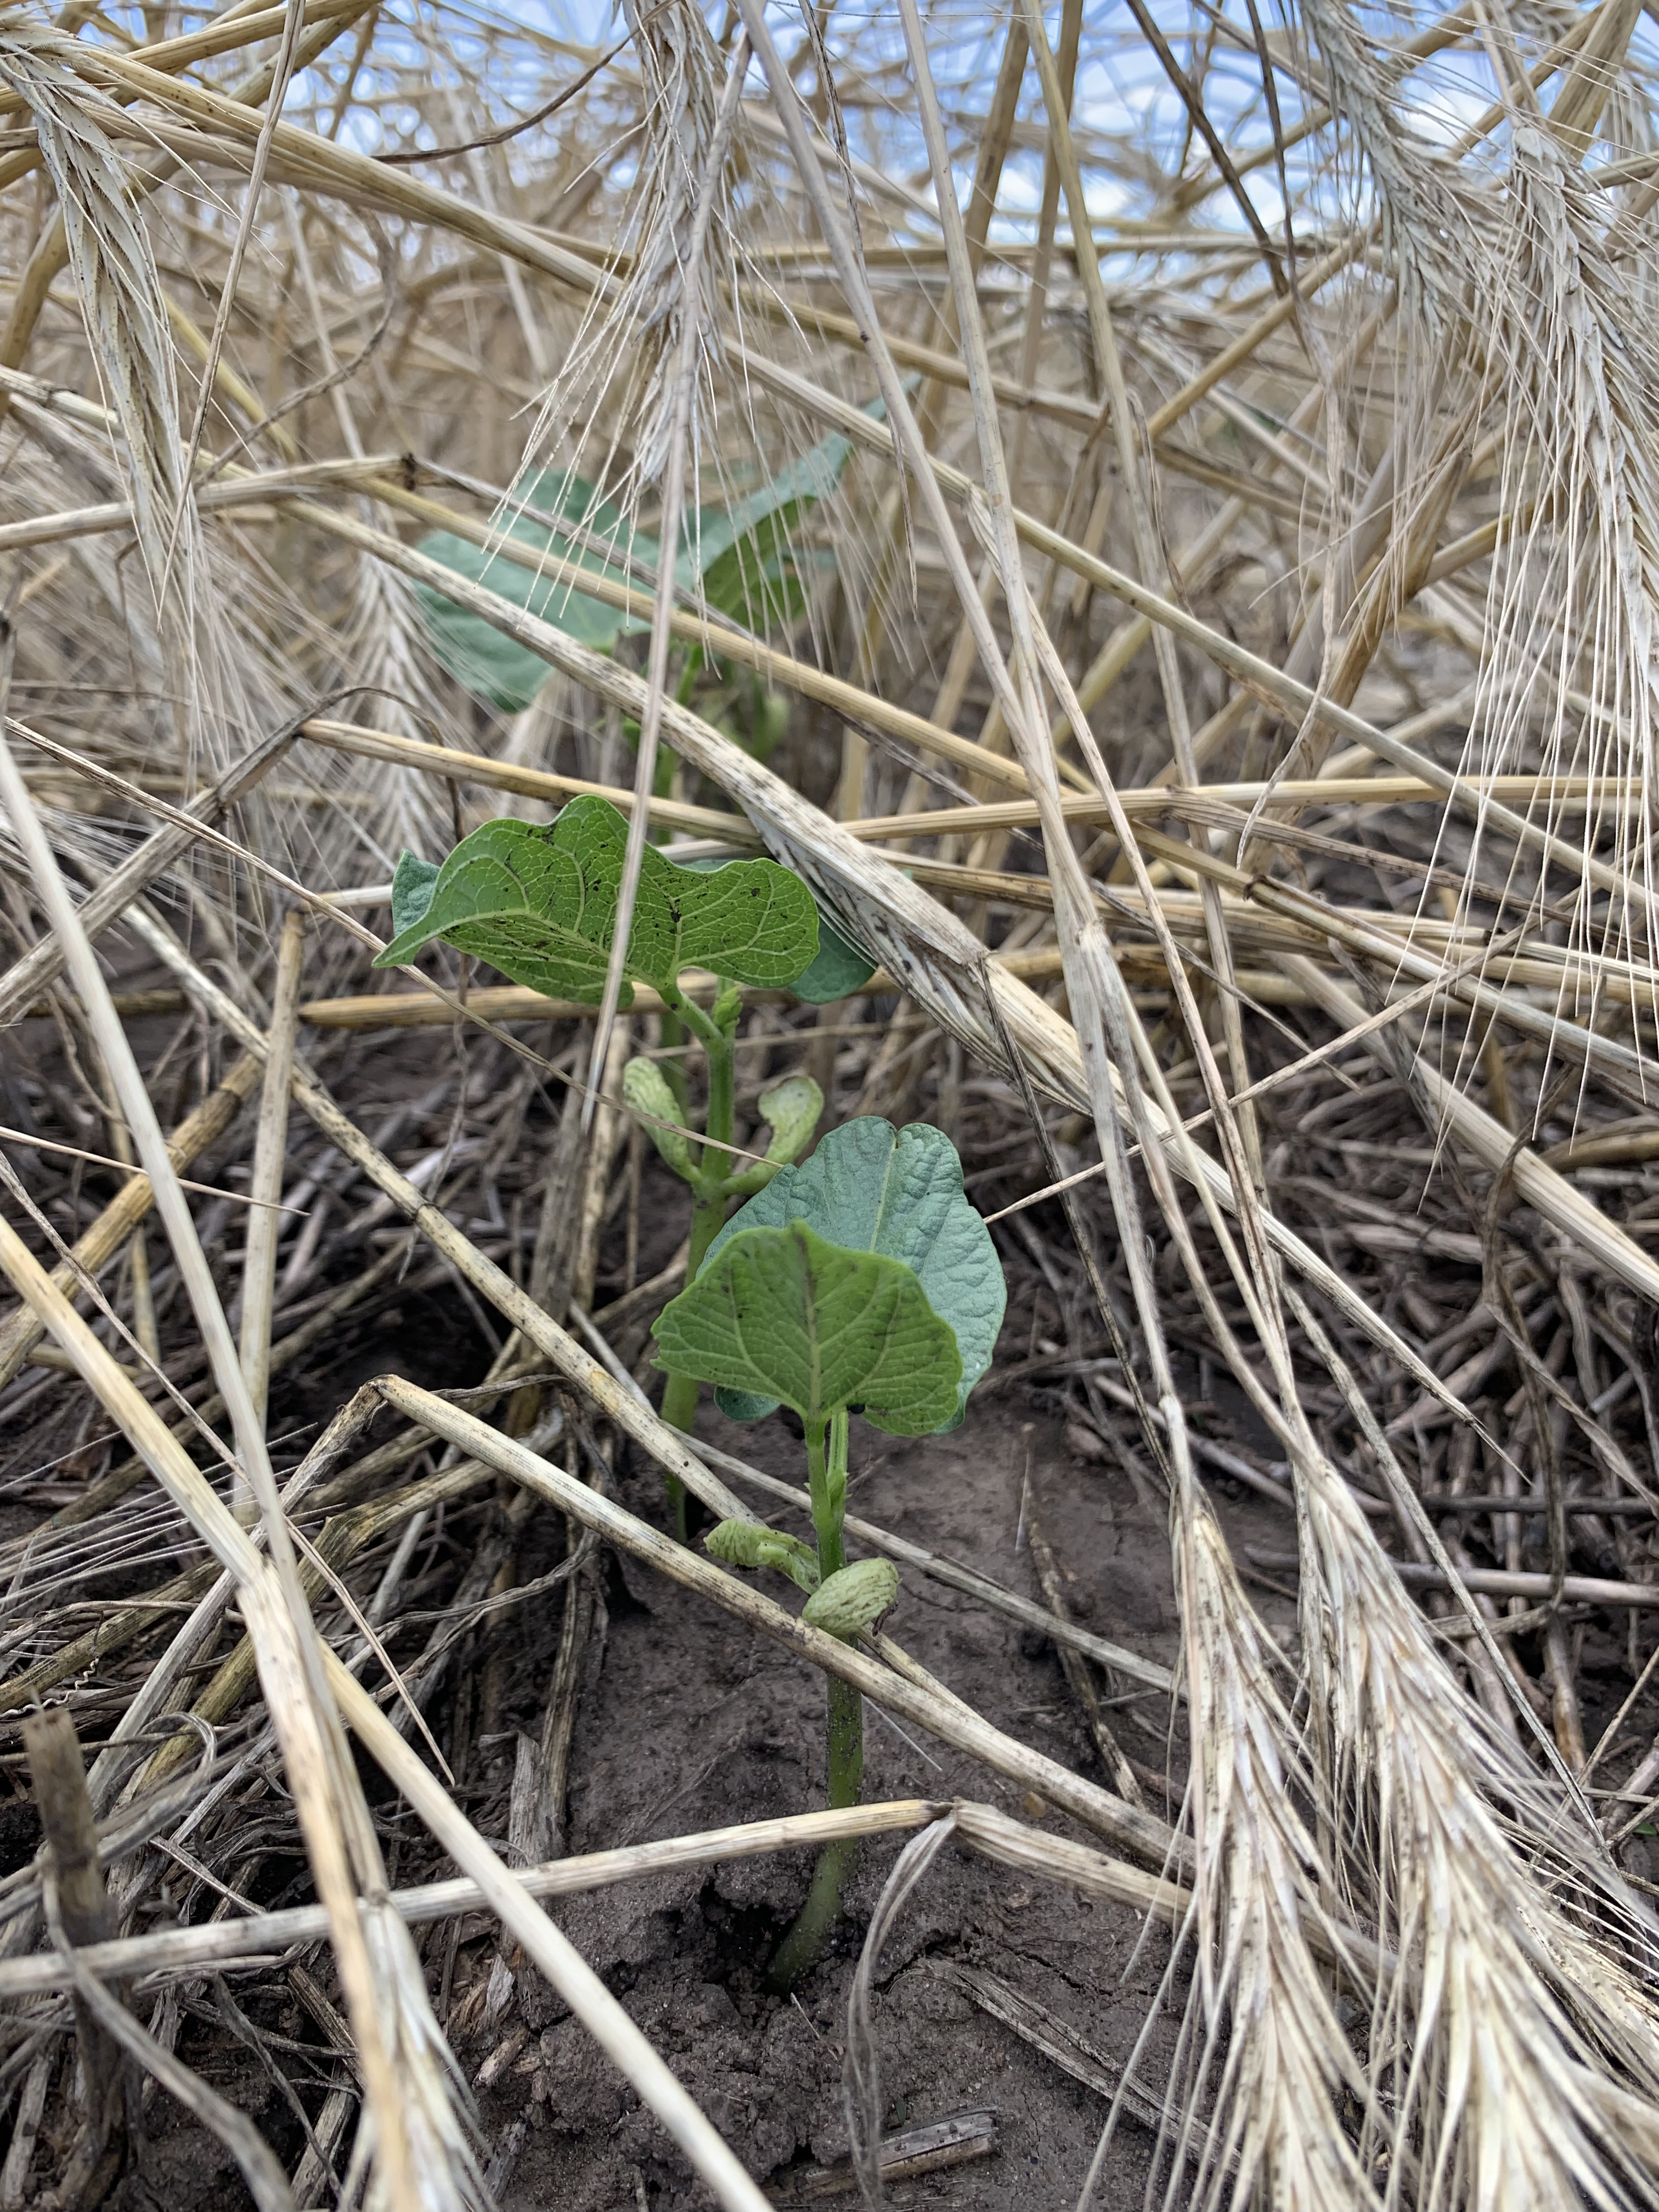
The CREC has completed three years of research with winter rye as a cover crop prior to pinto bean production (pictured above). Bean seed yield with rye (with proper management) can be maintained or exceeded vs. convention bean production while making use of the cover crop benefits including reduction in soil erosion and weed suppression. Generally dry spring soil conditions each of the three years dictated that the rye be terminated with glyphosate at least 2 weeks before the beans were planted to preserve soil moisture and bean seed yield. The study will continue in 2020.
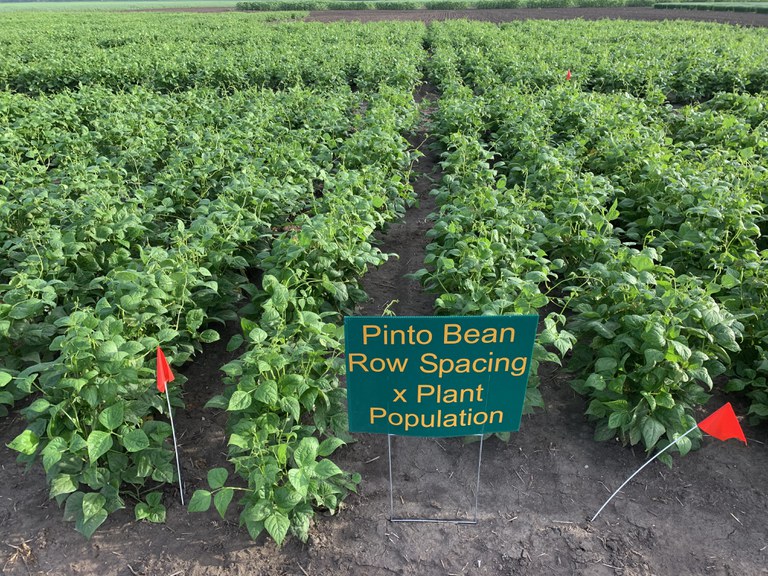
A CREC study is continuing to identify the best combination of pinto bean row spacing by plant population (pictured above). Averaged across five site-years, pinto bean in 21-22" rows averaged 18% greater yield vs. 28-30" rows. Averaged across four site-years, pinto bean density at 72,000 plants/acre resulted in 6% greater yield vs. 55,000 plants/acre. Two years of data with the interaction of rows by plant population is indicating highest yield with 21-inch rows and about 90,000 plants/acre. The study will continue in 2020 and will also include paired rows.
A dry bean educational workshop series titled ‘Dry Bean Production: Getting-it-Right’ will be conducted by NDSU Extension. The workshop’s objective is to provide dry bean growers and crop advisers with NDSU’s newest research and recommendations to enhance the crop’s production and profitability. General subjects include plant establishment, nutrition and protection (disease, weed and insect management); market update; and grower production techniques.
The meeting dates, times, locations and contacts are:
- Thursday, Jan. 30, 9 a.m. to 3:30 p.m., Park River City Auditorium, 504 Briggs Ave. S; for more information, contact Brad Brummond, NDSU Extension agent in Walsh County, at 701-284-6248 or bradley.brummond@ndsu.edu
- Friday, Jan. 31, 9 a.m. to 3:30 p.m., Festival Hall, Wells Co. Fairgrounds; for more information, contact Lindsay Maddock, NDSU Extension agent in Wells County, at 701-381-8606 or lindsay.maddock@ndsu.edu
The event is free of charge and preregistration is not necessary. Continuing education credits will be available for Certified Crop Advisers.
Greg Endres
Gregory.Endres@ndsu.edu
Extension Agronomist
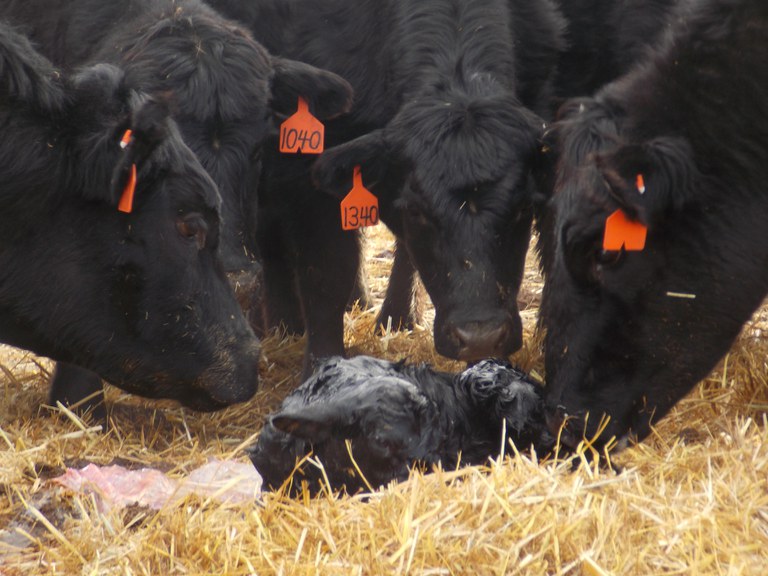
Calving Season Is Just Around the Corner: Are you ready?
When I walked into the livestock unit office the other morning, Tim asked me a few questions about ordering supplies for calving and preparing facilities. That kind of hit home and got me thinking, calving is only 9 weeks away. While we often think about the activities associated with calving, it is equally important to think about things that happen prior to calving and how they may impact our calving season.
Certainly, there is a lot of preparation – removing snow and cleaning calving areas, working on calving facilities, or giving pre-calving vaccines to cows and heifers, just to name a few. But, it is also important to think about cow body condition and adjust feeding practices if needed. It is recommended that spring calving cows be in a body condition score (BCS) of 5 or greater at the time of calving. Additionally, it is important to ensure that cows are receiving adequate nutrition prior to calving to allow for the energy demands at calving.
Each of us also need think about our family, co-workers, and ourselves as we move into calving season. Are we as livestock producers ready? First and foremost, in this conversation, needs to be safety. As most of us will be doing calving checks at night, often alone, it is important to have a plan in place for checking in with a spouse, family member or co-worker from time to time to make sure we are safe. Accidents are, by nature, unexpected. However, we can mitigate the risk of an accident by taking a few minutes to think about those unexpected events and how they can be addressed or prevented. Also, taking some time prior to calving to work on our own conditioning, nutrition, and strength will help each of us in preventing injury and making sure we are physically prepared to get through the calving season. The final point I would like to address is that of sleep. Please remember that regardless of what we think we can do, we are at our best when we all get adequate rest.
For more information on preparing for calving please see the following link: https://www.ag.ndsu.edu/publications/livestock/preparing-for-a-successful-calving-season-nutrition-management-and-health-programs/as1207.pdf
 We hope you all have a safe and productive calving season.
Bryan Neville, Ph. D.
Bryan.Neville@ndsu.edu
Animal Scientist
