
Long-Term (22 Years) Grazing Intensity Research in the Missouri Coteau of North Dakota
Prior to 1992, the amount of forage produced under the different grazing treatments was not significantly different. Starting in 1992, forage production under the various grazing treatments differed significantly on the silty range sites. During 1993, the same was true on overflow range sites. Tables 7 and 8 list the average forage production by treatment. For both types of range sites, the extreme grazing treatment produces the least forage. On the other hand, the ungrazed treatment is not the most productive. On silty range sites, the light treatment has the highest production. On overflow range sites, the light, moderate, and heavy treatments show little difference, but the moderate grazing treatment tends to be the most productive. No year-X-treatment interaction on overflow range sites has been found. That means the effect of grazing intensity on forage production is consistent across all of the study years. However, there is year-X-treatment interaction on silty range sites, which indicates that the weather for the year, or from the previous year, may affect which grazing treatment produces the most forage. At the beginning of the grazing season, the most productive site varies between the ungrazed, light, and moderate treatments, with the extreme or heavy treatments always proving to be least productive. At the middle of the season and in peak yield, the light treatment produces the most forage or is not significantly different from the most productive treatment, and the extreme treatment produces the least forage or is not significantly different from the least productive treatment. At the end of the season, the light or moderate treatment is most productive and the extreme or heavy treatment is least productive (although the ungrazed treatment produced the least forage in 1994), and the mean for the ungrazed treatment was greater than that of the light treatment in 2002 and 2009.
| Table 7. Average above ground biomass production by grazing treatment on silty range sites from 1992 to 2010. |
||||
|
|
Above ground biomass (lbs/acre) | |||
| Treatment | Beginning of season | Middle of season | Peak yield | End of season |
| Ungrazed | 1,253 b1 | 2,448 b | 2,728 c | 2,592 c |
| Light | 1,314 a | 2,765 a | 3,168 a | 3,071 a |
| Moderate | 1,178 c | 2,535 b | 2,941 b | 2,844 b |
| Heavy | 901 d | 2,148 c | 2,421 d | 2,339 d |
| Extreme | 732 e | 1,821 d | 2,189 e | 2,150 d |
|
LSD (0.05) |
59 | 142 | 183 | 196 |
|
1Means in the same column followed by the same letter are not significantly different at P=0.05. |
||||
|
Table 8. Average above ground biomass production by grazing treatment on overflow range sites |
||||
| Above ground biomass (lbs/acre) |
||||
| Treatment | Beginning of season | Middle of season | Peak yield | End of season |
| Ungrazed | 1,002 b1 | 3,205 c | 3,350 b | 2,928 b |
| Light | 1,156 a | 3,890 a | 4,173 a | 3,936 a |
| Moderate | 1,230 a | 3,666 ab | 4,116 a | 3,994 a |
| Heavy | 1,216 a | 3,566 b | 3,935 a | 3,901 a |
| Extreme | 841 c | 2,211 d | 2,606 c | 2,524 c |
| LSD (0.05) | 80 | 252 | 262 | 271 |
|
1Means in the same column followed by the same letter are not significantly different at P=0.05. |
||||
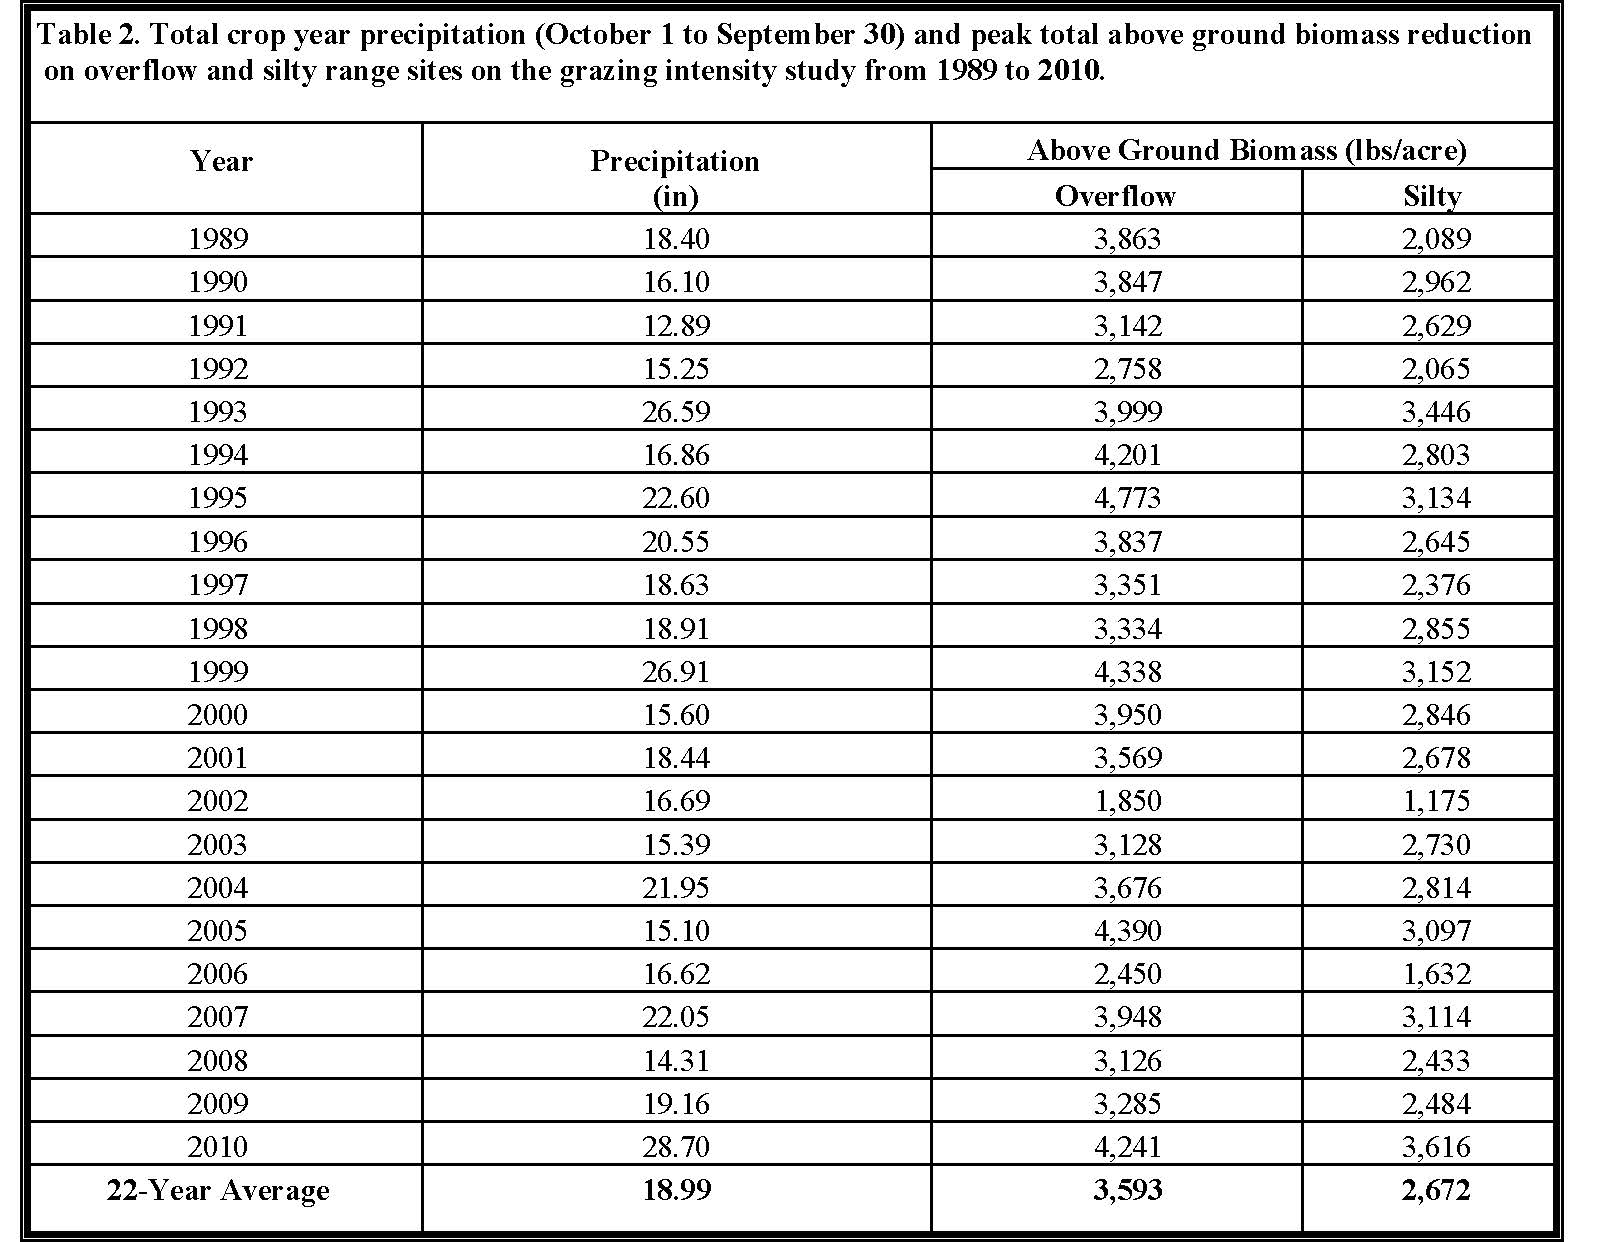
Although there were no significant differences between treatments in biomass production in 1991, the fact that there were differences at the beginning of the 1992 grazing season indicates that grazing must have reduced the amount of carbohydrate reserves the plants were able to carry over to the next season. Part of the variability in production on the ungrazed treatment may be the result of litter buildup that can prevent rainfall and sunlight from reaching the ground. In 1992 and 1993, the ungrazed treatment produced the most forage on silty range sites and production decreased as grazing intensity increased. Annual rainfall in 1993 was the third highest of any year during the study and the second greatest forage production on silty range sites occurred during that year (see Table 2). The buildup of litter in that year may have caused the ungrazed treatment to be the least productive treatment in 1994.
Soil Water and Forage Production
Soil water has been sampled bi-monthly throughout the growing season on each of the vegetation monitoring sites, and differences in available water have developed between the different grazing treatments. On overflow range sites, lightly grazed pastures have more available water than heavily grazed pastures. The differences in available water occur during both soil water recharge and discharge. This indicates that on heavily grazed sites, more water runs off during a rain, and sunlight evaporates more water from the soil surface. On silty range sites, moderately grazed pastures have more available water than ungrazed or heavily grazed pastures. The ungrazed treatment has less available water because the plants on that treatment have more leaf area than the grazed plants, and more water is removed from the soil by transpiration.
Forage Quality
The nutritional quality of the forage was sampled at the middle of the grazing season each year for the first 10 years of the study. On silty range sites, the grasses have higher crude protein and digestibility and lower fiber components at the higher grazing intensities. On the heavily grazed treatments, the grass that is available for grazing is mostly regrowth, which is of higher quality. However, on overflow sites, both grasses and forbs are highest in fiber components on the heavy grazing treatment. Perhaps on these sites cattle are selecting species of higher quality and leaving those that are higher in fiber. On silty sites, forbs are highest in neutral detergent fiber on the ungrazed and extreme grazing treatments. As the forage matures on the ungrazed treatment, it becomes higher in fiber. On the heavily grazed treatments, only forbs of lower quality remained ungrazed. These differences in nutritional quality have occurred gradually over the course of the study.
Table of Contents
- Introduction
- Stocking Rate
- Livestock Response
- Effect of Grazing Intensity on Forage Production and Utilization, Soil Water and Forage Quality
- Plant Community Dynamics
- Recommendations
