
Long-Term (22 Years) Grazing Intensity Research in the Missouri Coteau of North Dakota
Table 4 shows the average daily gain, gain per acre, gain per ton of forage, and body condition scores from the different grazing intensities. Grazing pressure was too light on the heavy and extreme treatments in the first two years of the study, so no significant differences in average daily gains were observed in 1989 and 1990. Since 1990, average daily gain and animal body condition scores have decreased with increasing grazing intensity each year with four exceptions: 2001, 2006, 2007 and 2010. The rate at which average daily gain decreases with an increase in stocking rate varies greatly from year to year. The differences between years may be due to variation in forage quality or quantity, the effect of weather on the animals, the animals’ initial weights, or their potential to gain. We would like to begin taking a mid-season weight on the cattle. This will allow us to determine if the animals on the heavily stocked pastures gain consistently less throughout the grazing season or if they gain well in the first half of the grazing season and then gain more slowly or lose weight in the second half of the season. We were able to do this in 2008 but not in 2009 or 2010. In 2008 all the cattle on all grazing treatments gained at a slower rate in the later part of the grazing season, August 1 to August 25, than they did in the first part of the grazing season, May 20 to August 1. The extreme grazing treatment had a significantly slower rate of gain in the first part of the grazing season than the other treatments, but there was no significant difference in the rate of gain between treatments in the last 25 days of the grazing season.
| Table 4. Average daily gains, gains per acre, gains per ton of forage and condition scores from different stocking intensities. | ||||||
| Desired Grazing Intensity |
Average Daily Gains (lbs./head/day) |
|||||
| 2006 | 2007 | 2008 | 2009 | 2010 | Average 1991-2010 | |
| Light | 0.57 | 1.36 | 1.75a1 | 2.05a | 1.54 | 1.39a |
| Moderate | 0.62 | 1.22 | 1.58ab | 1.99a | 1.29 | 1.28a |
| Heavy | 0.48 | 1.33 | 1.35b | 1.48b | 1.09 | 1.10b |
| Extreme | 0.13 | 1.16 | 0.95c | 1.09b | 1.02 | 0.80c |
| LSD (0.05) | NS2 | NS | 0.38 | 0.42 | NS | 0.14 |
|
Average Gain (lbs./acre) |
||||||
| 2006 | 2007 | 2008 | 2009 | 2010 | Average 1991-2010 | |
| Light | 11.01 | 44.41c | 39.73b | 47.37b | 47.58 | 30.02c |
| Moderate | 20.82 | 69.27bc | 68.61ab | 90.63a | 68.95 | 55.19b |
| Heavy | 20.77 | 107.47ab | 82.15a | 92.72a | 84.55 | 76.45a |
| Extreme | 7.48 | 122.96a | 76.10a | 90.79a | 104.70 | 81.42a |
| LSD (0.05) | NS | 42.67 | 29.04 | 34.31 | NS | 10.30 |
|
Average Gain (lbs./ton of forage) |
||||||
| 2006 | 2007 | 2008 | 2009 | 2010 | Average 1991-2010 | |
| Light | 9.83 | 23.19c | 27.11c | 33.80b | 19.01c | 19.53d |
| Moderate | 19.81 | 39.26bc | 51.13b | 62.10ab | 31.24bc | 35.19c |
| Heavy | 26.25 | 64.56ab | 70.51ab | 77.54a | 52.54ab | 59.21b |
| Extreme | 14.00 | 82.26a | 78.22a | 92.90a | 64.87a | 73.44a |
| LSD (0.05) | NS | 27.81 | 22.96 | 33.78 | 27.37 | 8.66 |
|
Condition Score |
||||||
| 2006 | 2007 | 2008 | 2009 | 2010 | Average 1994-2010 | |
| Light | 5.08 | 5.60 | 6.99a | 5.77 | 5.24 | 5.47a |
| Moderate | 5.17 | 5.50 | 6.51b | 5.52 | 5.19 | 5.36ab |
| Heavy | 5.02 | 5.54 | 6.38b | 5.46 | 5.16 | 5.24b |
| Extreme | 4.81 | 5.41 | 5.82c | 4.97 | 5.05 | 4.93c |
| LSD (0.05) | NS | NS | 0.39 | NS | NS | 0.18 |
|
1Means in the same column followed by the same letter are not significantly different at p=0.05. 2Means not significantly different. |
||||||
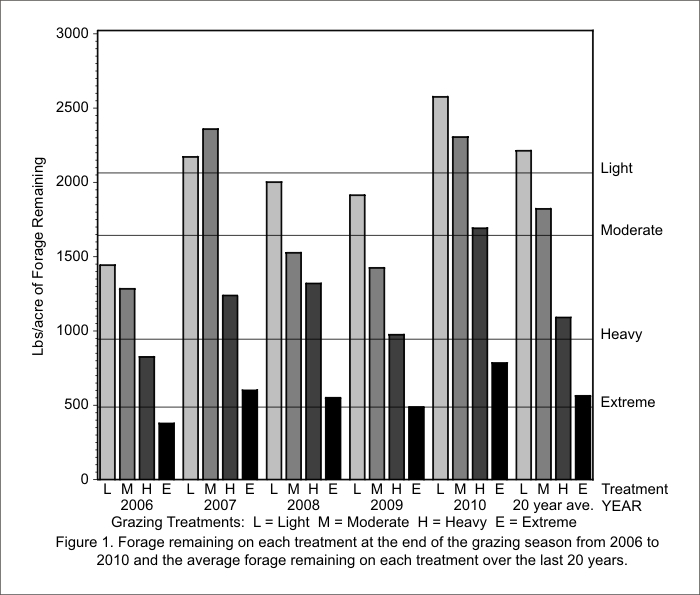
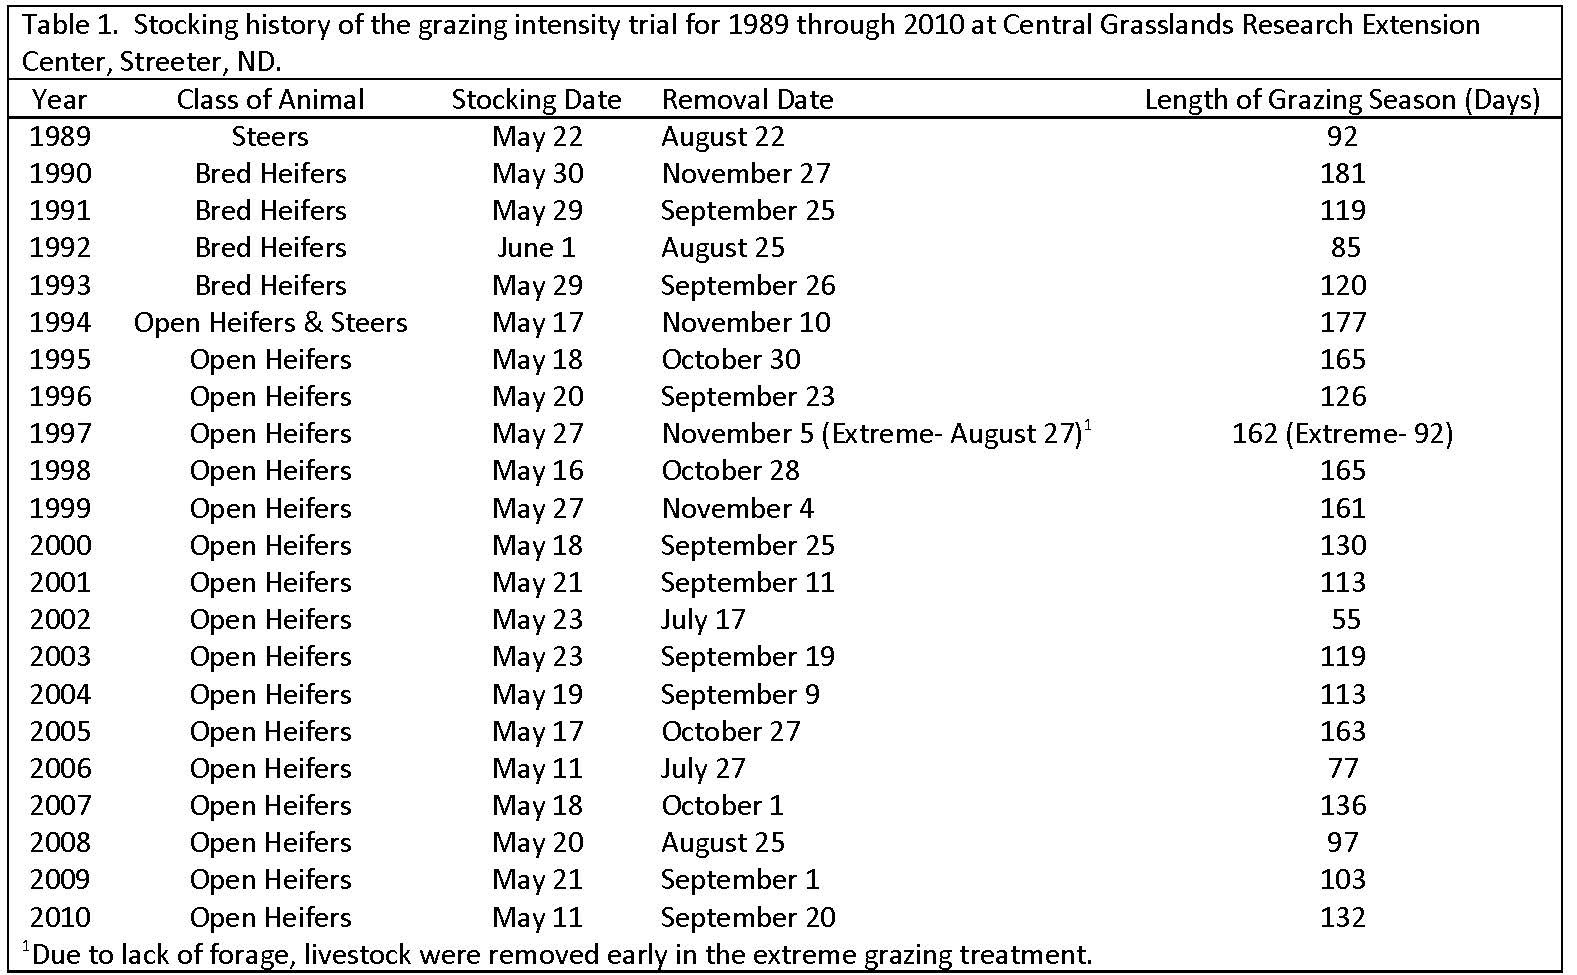
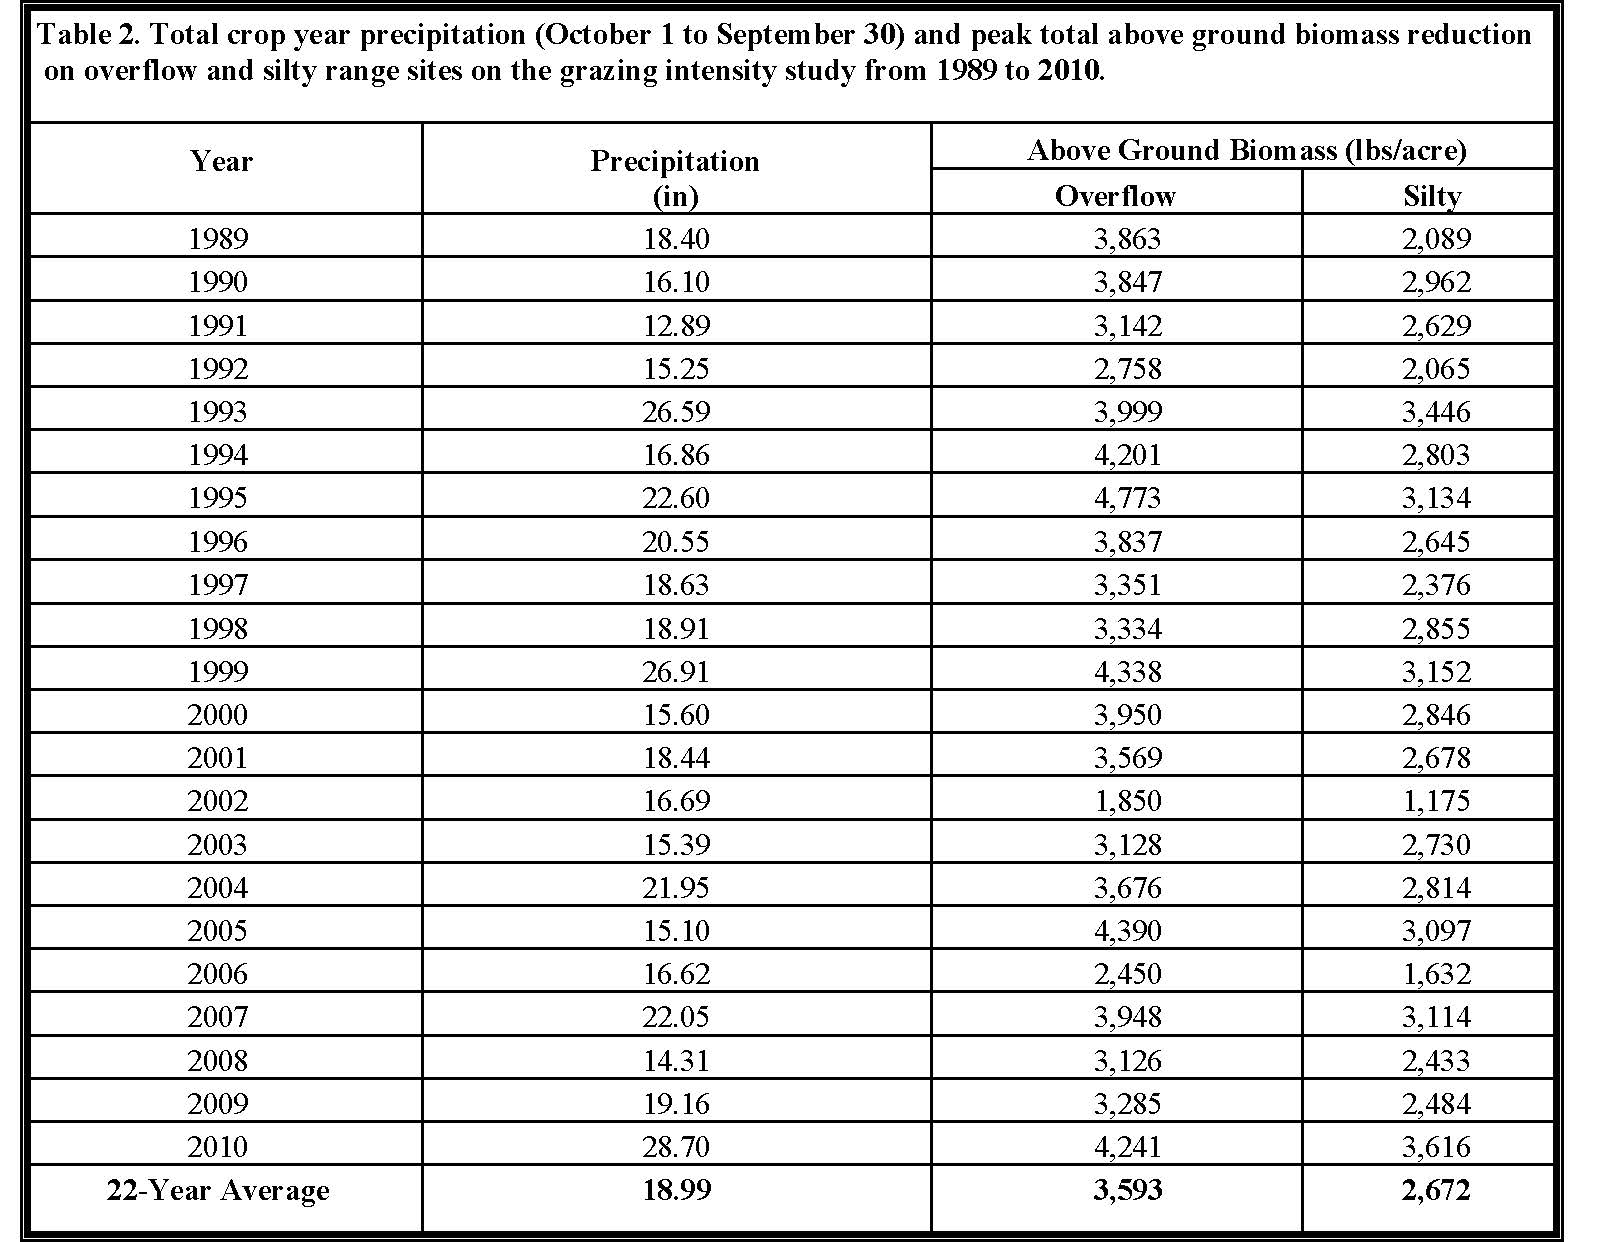
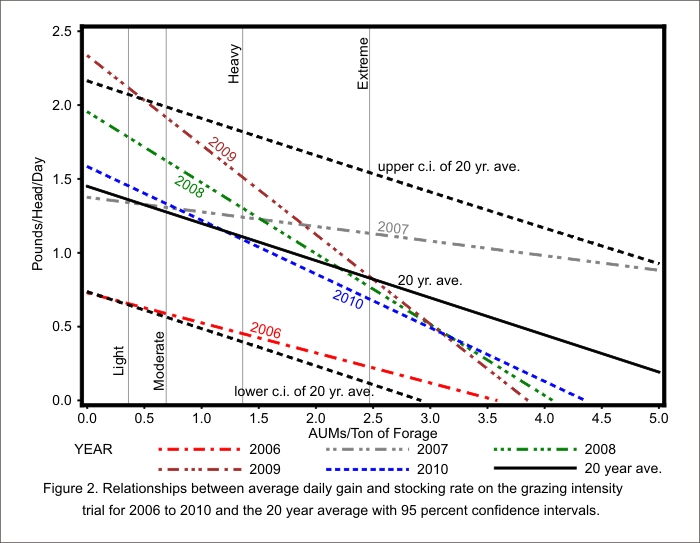
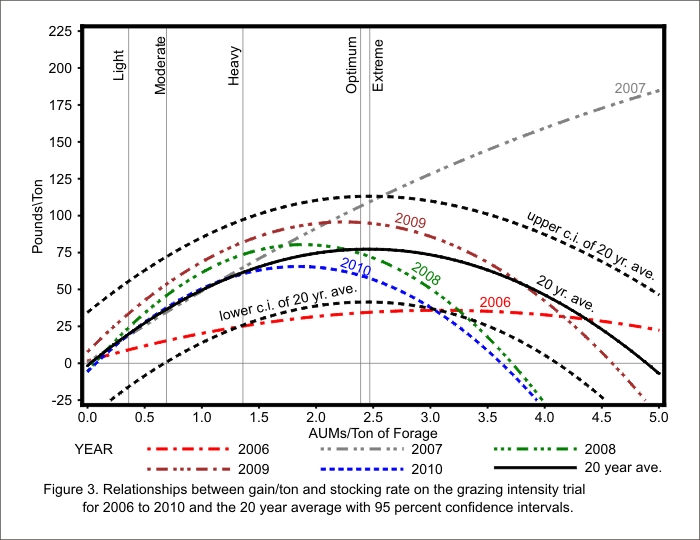
If all years are pooled together, the relationship between daily gain and stocking rate/acre has an R2 of 0.29, while the relationship between daily gain and stocking rate/ton of forage has an R2 of 0.32 which means that stocking rate explains 29 or 32% of the variation in average daily gain between pastures. When only one year is considered at a time, the R2 varies between 0.09 and 0.92 on a per acre basis and between 0.10 and 0.94 on a per ton of forage basis, with the 0.09 and 0.10 coming from 2007. The next lowest R2 was 2006, with R2s of 0.25 and 0.33, and third was 2001, with R2s of 0.45 and 0.43. Therefore, ignoring 2006 and 2007, between 43 and 94% of variation in average daily gain is a result of the difference in stocking rate. Forage production was well above average in 2007 and gains had not become forage-limited on the heavily grazed pastures by the time the cattle were removed (Figure 1.). Forage production was well below average in 2006 and cattle were removed early, before the stocking rate had much opportunity to influence average daily gains (Tables 1 and 2, Figure 1). The relationships between stocking rate and average daily gain are illustrated in Figure 2. Reference lines indicate the average stocking rates for each of the four grazing treatments. Initially, gain/ton of forage increased as the stocking rate increased, but there comes a point when further increases in stocking rates result in reduced gain/ton (see Figure 3).
What happens at stocking rates beyond the extreme stocking rate reference line is mainly hypothetical because we have very few observations on which to base our regression lines. However, all but 2001, 2003, and 2007 had at least one observation from a stocking rate higher than the projected rate that would provide maximum gain/ton for the year. Table 5A shows the stocking rate that would have resulted in the maximum gain/ton of forage in each year. Since we cannot predict ahead of time which stocking rate will give the maximum gain/ton in a particular year, it would be impossible to stock each year for maximum gain/ton. In retrospect, if we were to pick one stocking rate that would have resulted in the maximum gain/ton from 1991-2010, it would be 2.39 AUM/ton. This is the point labeled optimum in Figure 3. Table 5B shows what the gain/ton would have been each year if we had stocked at that rate. We predict that if we had stocked at 2.39 AUM/ton each year, gain/ton would have ranged from a gain of 34.2 lbs./ton in 2006 to 145.1 lbs./ton in 1992 with an average of 75.7 lbs./ton. Table 5C shows what the gain/ton would have been each year if the stocking rate had been held constant at 0.69 AUM/ton, the average of the moderate treatment over this period.


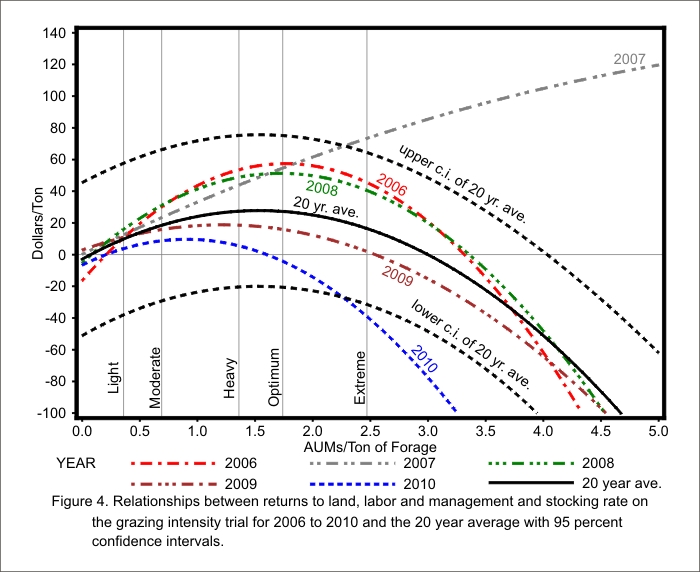
Figure 4 shows the relationship between stocking rate and economic return. Costs for land, labor, and management are not included because these values vary greatly from one operation to another. If cattle prices were steady, then return/ton would peak at a stocking rate somewhere below maximum gain/ton, with the exact point depending on carrying costs (interest, death loss, salt and mineral cost, veterinary cost, transportation, labor, and land). However, when cattle are worth more per hundredweight in the spring than they are in the fall, the point of maximum return/ton occurs at a lower stocking rate. When the cattle are worth more in the fall, the maximum return/ton occurs at a higher stocking rate. Again, returns for stocking rates beyond the extreme stocking rate reference line are hypothetical and all but 1992, 2001, 2003, and 2007 had at least one observation from a stocking rate higher than the rate that would provide maximum return to land, labor, and management for the year. Table 6 shows what the optimum return/ton would have been for each year if stocking rate were set for the optimum for that year (A), if the stocking rate were held at a constant optimum rate (B), or if the stocking rate were held constant at the moderate stocking rate (C). The peaks of the curves in Figure 4 correspond to these optimum stocking rates. If we were to pick one constant stocking rate that would have provided the maximum return/ton over the last 20 years, it would be 1.74 AUM/ton. This is the point labeled "optimum" in Figure 4. This year (2010), cattle prices were higher in the spring than in the fall for cattle weighing less than 875 lbs. This coupled with the lower rate of gain of cattle on the higher stocking rates would put the maximum return for 2010 at $9.67/ton if stocked at 0.90 AUM/ton. Although the average return/ton is higher under the optimum stocking rate, there were six years with negative returns, while only one year had a negative return under the moderate stocking rate. (Costs for land, labor, and management have not been subtracted). If you compare Tables 5 and 6 you can see that the stocking rate with the greatest economic return was less than the rate with the greatest gain per ton of forage in all but two years (1999 and 2004).

| Table 6. Comparison of return to land, labor and management from selected stocking rates. | |||||||||
| A | B | C | |||||||
| Stocking rate in AUMs/ton of forage that would result in the maximum returns/ton to land, labor and management in each year. | Stocking rate in AUMs/ton of forage that if held constant would result in the maximum returns/ton to land, labor and management over the twenty-year period. | Returns/ton to land, labor and management over the twenty-year period if stocking rate were held constant at 0.69 AUMs/ton of forage, the average of the moderate treatment over this period. | |||||||
| Year | AUMs/ton of forage | Dollars/ton | Gain/ton | AUMs/ton of forage | Dollars/ton | Gain/ton | AUMs/ton of forage | Dollars/ton | Gain/ton |
| 1991 | 0.42 | 1.81 | 18.3 | 1.74 | (6.28) | 50.5 | 0.69 | 1.45 | 27.4 |
| 1992 | * | 1.74 | 80.90 | 122.0 | 0.69 | 34.38 | 57.9 | ||
| 1993 | 1.42 | 59.35 | 91.9 | 1.74 | 56.26 | 100.1 | 0.69 | 44.06 | 53.8 |
| 1994 | 0.55 | 0.95 | 21.1 | 1.74 | (10.82) | 40.0 | 0.69 | 0.79 | 25.1 |
| 1995 | 0.86 | 0.53 | 34.3 | 1.74 | (4.72) | 54.5 | 0.69 | 0.33 | 28.7 |
| 1996 | 2.57 | 32.88 | 62.0 | 1.74 | 29.31 | 52.6 | 0.69 | 14.68 | 25.8 |
| 1997 | 1.13 | 15.53 | 69.3 | 1.74 | 9.60 | 89.5 | 0.69 | 12.63 | 46.6 |
| 1998 | 0.63 | 0.31 | 36.7 | 1.74 | (8.78) | 73.3 | 0.69 | 0.28 | 40.2 |
| 1999 | 3.53 | 55.20 | 108.3 | 1.74 | 40.52 | 80.8 | 0.69 | 18.29 | 37.1 |
| 2000 | 2.06 | 16.15 | 66.4 | 1.74 | 15.71 | 61.2 | 0.69 | 8.16 | 30.4 |
| 2001 | * | 1.74 | 40.02 | 81.2 | 0.69 | 18.37 | 36.6 | ||
| 2002 | 0.00 | 12.93 | 7.1 | 1.74 | (17.39) | 72.0 | 0.69 | (3.56) | 40.6 |
| 2003 | * | 1.74 | 74.37 | 55.1 | 0.69 | 35.15 | 28.7 | ||
| 2004 | 1.98 | 83.72 | 69.5 | 1.74 | 82.30 | 77.4 | 0.69 | 42.66 | 49.5 |
| 2005 | 1.25 | 10.83 | 36.4 | 1.74 | 8.84 | 44.2 | 0.69 | 8.31 | 22.8 |
| 2006 | 1.76 | 57.41 | 29.6 | 1.74 | 57.40 | 29.4 | 0.69 | 30.28 | 15.3 |
| 2007 | * | 1.74 | 54.65 | 80.9 | 0.69 | 23.56 | 34.7 | ||
| 2008 | 1.72 | 51.30 | 79.7 | 1.74 | 51.29 | 79.9 | 0.69 | 31.22 | 46.1 |
| 2009 | 1.22 | 18.82 | 77.3 | 1.74 | 15.87 | 91.3 | 0.69 | 15.87 | 53.7 |
| 2010 | 0.90 | 9.67 | 47.0 | 1.74 | (4.25) | 65.3 | 0.69 | 8.78 | 37.8 |
| 20-year avg. | 1.38 | 26.71 | 53.4 | 1.74 | 28.24 | 70.1 | 0.69 | 17.28 | 36.9 |
| * The regressions for 1992, 2001, 2003 and 2007 were not suitable to project the peak in returns to land, labor and management. | |||||||||
Table of Contents
- Introduction
- Stocking Rate
- Livestock Response
- Effect of Grazing Intensity on Forage Production and Utilization, Soil Water and Forage Quality
- Plant Community Dynamics
- Recommendations
