The North Dakota Grazing Monitoring Stick: A Way to Measure Range and Pasture Utilization (R1780, April 2021)
Availability: Web only
Pastureland is grazing lands planted with introduced or domesticated native forage species. Common grass species planted for pastureland in North Dakota include intermediate wheatgrass, crested wheatgrass and smooth bromegrass.
Rangeland is areas of native vegetation dominated by grasses managed through manipulation of livestock grazing and/or prescribed fire. Types of rangeland include grassland, shrubland, woodland and savanna.
Utilization is a measure of the percent of the plant’s leaf area that has been removed and/or destroyed by grazing animals. A common misconception is that this is a measure of the removal of cover (height), when the recommendation is based on plant weight.
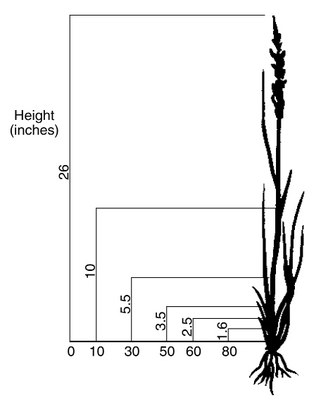
As a general rule of thumb, proper utilization is achieved when 50% of the total plant weight (not height) of key species has been utilized (Figures 1, 2 and 3). Due to differences in structure, the height of removal will vary among species, so knowing the key forage species in your pasture and rangeland is important.
Monitoring the utilization of grass can be used to determine the livestock removal date and prevent overuse or long-term impacts of overgrazing of range and pasture resources. The GMS is a modified yardstick with information related to grazing management and utilization to aid in monitoring grazing resources.
This publication is a guide to the North Dakota Grazing Monitoring Stick. Guidelines are based on plant communities of the northern Great Plains. The protocol presented in the following sections must be implemented to insure that the GMS is providing you with the correct information for your pasture or range.
The video below demonstrates how to use the North Dakota Grazing Monitoring Stick to measure range and pasture utilization.
Figures 1, 2 and 3 show different grasses and the relationship between plant height and weight. Because most of the weight of a grass plant is near the base, 50 percent use by weight is not the same level as 50 percent use by height.
Figure 1. Percent of weight of western wheatgrass utilized at different stubble heights1.
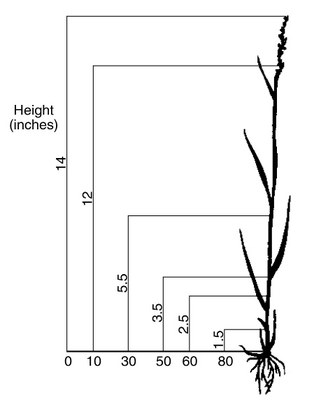
Figure 2. Percent of weight of needle-and-thread utilized at different stubble heights1.
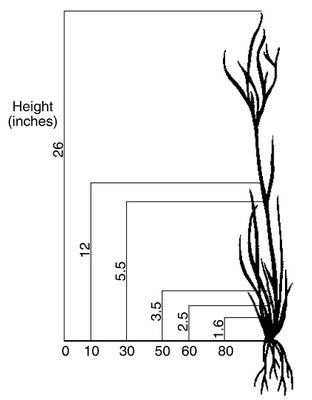
Figure 3. Percent of weight of green needlegrass utilized at different stubble heights1.
1Montana State University. 1987.
Keys to Measuring Utilization
To assess utilization accurately, taking multiple measurements across the pasture is critical to account for variability in utilization and ecological sites. You should take a minimum of 30 measurements for each key species across a pasture to account for variability, based on recommendations from the Natural Resources Conservation Service.
A key species would be defined as the dominant grass within the pasture or the grass species selected for monitoring the pasture. If you have a large grazing unit or one that has numerous ecological sites, you should take additional measurements.
When selecting sites, avoid heavy-use areas such as waters, salts and gates. Monitor utilization throughout the grazing period to ensure that you achieve proper utilization and to prevent overuse of key species.
As a general rule of thumb, proper utilization is 50% of the total plant weight (not height) of key species utilized or removed. Final utilization levels should be evaluated within three days of livestock removal.
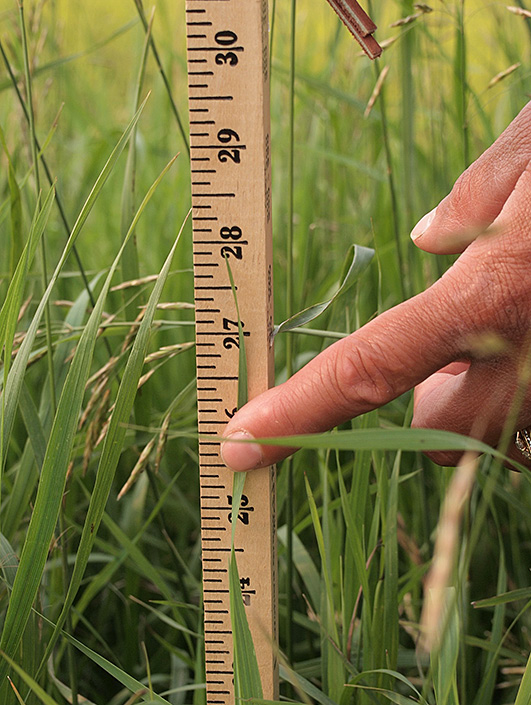
When measuring the height of key grass species, you must follow proper protocol (Figures 4, 5 and 6).
- Place the stick upright, without it leaning.
- Measure the leaf height of the key grass species in the area grazed.
- Choose a plant that is representative of other plants in the area.
- Be sure to evaluate the current year’s green leaf growth. If the leaf is bent or curled, use your finger to extend the leaf, using care not to pull (Figure 5).
- Do not measure to the top to the inflorescence.
- Repeat step 2 in an ungrazed area. This is required to calculate percent removal.
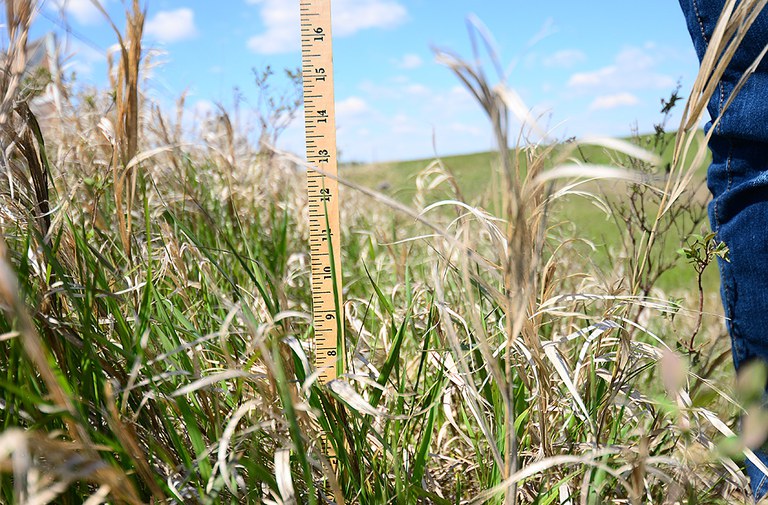
- Figure 4. In this example, the top of the smooth bromegrass is at 12.5 inches. Note: The average size of grasses in an area should be measured. (NDSU photo)
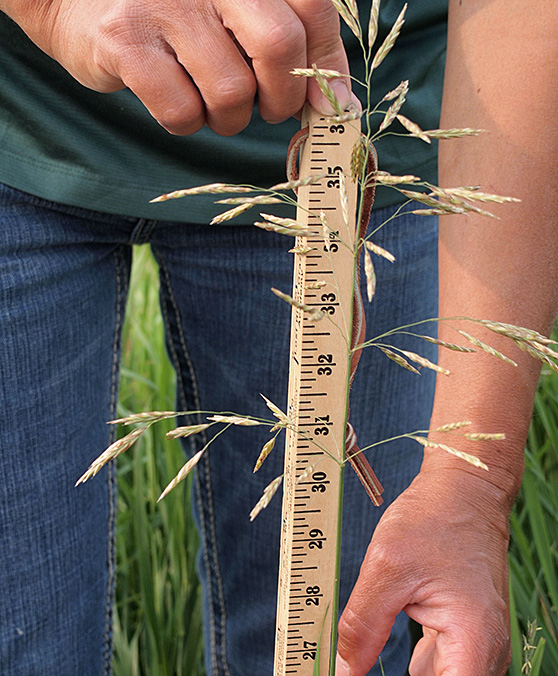
- Figure 6. Make sure your measurement is at the leaf tip and not the flowering tip. In this example to the right, the smooth bromegrass leaf measures 28 inches. (NDSU photo)
Photos by Fara Brummer, NDSU
Grazing Management Guidelines
Identification of the key species in your pasture and rangeland is critical to implementing a successful grazing management plan. Because plant growth and recovery vary among species, knowledge of a plant’s season of growth and whether the plants are native or introduced is important. This portion of the GMS provides guideline on plant growth and recovery (Table 1).
Introduced species initiate growth earlier in the spring than native species and can be grazed at the three-leaf stage in early May. However, native cool-season plants do not reach grazing readiness, the 3½-leaf stage, until mid- to late May or early June, and native warm-season plants do not reach grazing readiness until mid- to late June. For more information on grazing readiness, refer to the NDSU Extension publication “Determining Grazing Readiness for Native and Tame Pastures” (www.ag.ndsu.edu/publications/environment-natural-resources/determining-grazing-readiness-for-native-and-tame-pastures).
In general, cool-season plants grow more rapidly from mid-May to mid-June, and warm-season grasses grow more rapidly from mid-June to late July. The decision to initiate grazing should be based on dominant species in the plant community and management goals.
Giving plants sufficient recovery time following grazing is important. The greater the utilization of a plant, the more time it will need to recover. Precipitation and climatic conditions influence the time needed for a plant to recover. As a result, recovery rates vary from eastern to western North Dakota. Notice the difference of 15 to 20 days for rangeland and 10 days for pastureland between eastern and western North Dakota.
Minimum Heights for Introduced Pasture Species
Leaf stage and height should be used to determine grazing readiness for pastures planted with introduced species. Grazing plants prior to grazing readiness can cause a reduction in herbage production, which can reduce the stocking rate and animal performance.
A similar response occurs when plants are overgrazed and not given adequate time to replenish root reserves prior to the next grazing period. Table 2 recommends minimum heights to start and stop grazing on common pasture species.
|
Table 1. Grazing Management Guidelines2 |
||
|
Slow plant growth - move slow Avoid grazing the same native pasture at the same time every year. Provide enough recovery time before regrazing a pasture. |
||
|
Recovery Periods - Rangeland |
||
|
|
Fast growth - May/June |
Slow growth - July/August |
|
Western ND |
minimum of 45 days |
minimum of 65 days |
|
Eastern ND |
minimum of 30 days |
minimum of 45 days |
|
Recovery Periods - Introduced Pasture |
||
|
|
Fast growth - May/June |
Slow growth - July/August |
|
Western ND |
minimum of 25 days |
minimum of 35 days |
|
Eastern ND |
minimum of 15 days |
minimum of 25 days |
2Adapted from NRCS Field Office Technical Guide, February 2012
|
Table 2. Minimum Heights for Introduced Pasture Species2 |
||
|
Species |
Begin Grazing |
End Grazing |
|
Inches |
Inches |
|
|
Alfalfa |
6-10 |
3 |
|
Crested wheatgrass |
4-6 |
3 |
|
Intermediate wheatgrass |
8-14 |
4 |
|
Kentucky bluegrass |
4-6 |
2 |
|
Reed canarygrass |
8 |
4 |
|
Smooth bromegrass |
8-14 |
4 |
|
Grass and legume mixes should be grazed in a manner that favors the dominant desired species. |
||
2Adapted from NRCS Field Office Technical Guide, May 2010
Utilization of Key Species
This section provides information on calculating utilization of key species based on height measurements of grazed and ungrazed plants (Table 3). To determine utilization, you must take measurements prior to pasture turnout, during the grazing period and within three days of the removal of livestock.
Follow these steps to calculate utilization:
- Calculate the percent of the plant height removed by dividing the grazed height of the plant by the ungrazed height. Subtract this amount from 1.
- Multiply this amount by 100 to determine the percent of height removed.
- Correlate this number with those in the chart to estimate the percent of entire plant weight removed.
Example: If your plant has been grazed down to 3 inches from a standing 12 inches, your calculation will be:
[1 – (3 inches ÷ 12 inches)] x 100 = 75 percent of the plant has been removed.
|
Table 3. Utilization of Key Species2 |
||||||
|
1) Calculate the percent of the height of the plant removed by grazing: |
||||||
|
2) Find the percent height removed on the top line of the chart and follow the column down to the appropriate species. The numbers in the chart are an estimate of the percent of the weight removed. |
||||||
|
Height to Weight Utilization Chart |
||||||
|
Percent of Height Removed => |
65 |
70 |
75 |
80 |
85 |
90 |
|
Tall warm-season grasses (big bluestem, switch) |
41 |
46 |
54 |
62 |
71 |
79 |
|
green needle/crested wheat/little bluestem |
35 |
38 |
45 |
53 |
61 |
70 |
|
western wheatgrass |
44 |
50 |
58 |
66 |
74 |
82 |
|
blue grama/needle-and-thread |
19 |
24 |
29 |
36 |
44 |
54 |
|
intermediate wheat/smooth brome |
37 |
45 |
52 |
58 |
63 |
82 |
|
Kentucky bluegrass |
26 |
34 |
40 |
47 |
57 |
71 |
2Adapted from NRCS Field Office Technical Guide, May 2010
Key Species
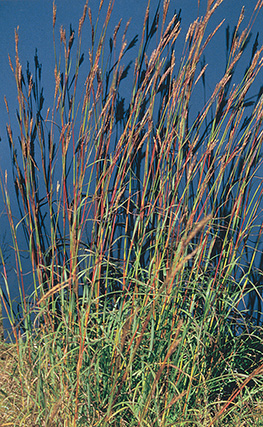
- Big bluestem
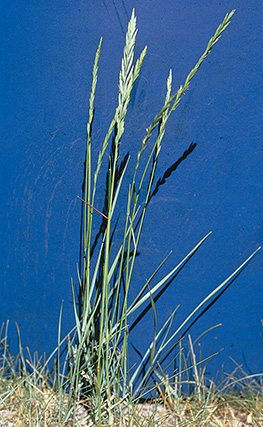
- Western wheatgrass
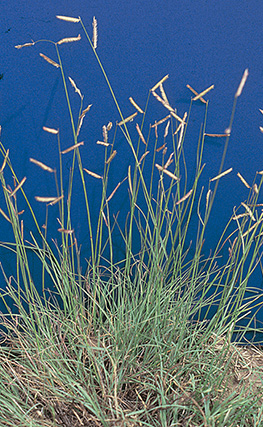
- Blue grama
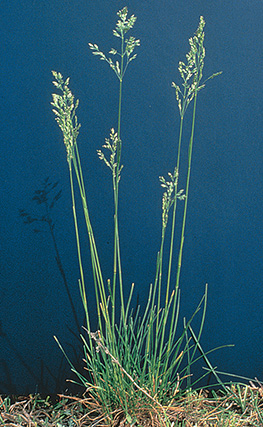
- Kentucky bluegrass
Height to Weight Chart
Use the percent of height removed that you calculated and correlate it to the appropriate grass community classifications to find the percent in weight utilization of your grass. Each plant community has a number in bold in its row. This is the percent by weight utilization that is the minimum for proper regrowth. If you increase your utilization number, you are in danger of robbing that plant of its resources and may decrease production and sustainability of your ranch.
Our example of 75 percent utilization by height (in italics) shows an estimate of the plant weight removal as indicated on the grazing stick.
- Tall warm-season grasses (big bluestem, switch) (example: 54 percent weight removal)
- Green needle/crested wheat/little bluestem (example: 45 percent weight removal)
- Western wheatgrass (example: 58 percent weight removal)
- Blue grama/needle-and-thread (example: 29 percent weight removed)
- Intermediate wheat/smooth brome (example: 52 percent weight removed)
- Kentucky bluegrass (example: 40 percent weight removed)
Note: For a western wheatgrass-dominated plant community, 75 percent removal of height indicates we removed 58 percent of the plant by weight and livestock should be removed from the pasture.
A general rule of thumb is to target 50% utilization by weight during a grazing period as well as at the end of the grazing season. If greater than 50% utilization occurs during a grazing period, plant recovery will be slower, requiring a longer recovery period between grazing events to maintain plant health. Through time, grazing beyond 50% removal of a plant community’s weight results in diminished grass growth, resulting in reduced stocking rates and animal performance.
Evaluating Existing Stocking Rates
If recommended utilization of key species is not being achieved or is being exceeded, we recommend that stocking rates be evaluated and adjusted accordingly. The stocking rate is the number of specific kinds and classes of animals grazing or utilizing a unit of land for a specific period of time. Stocking rate commonly is expressed as animal units per acre.
If utilization goals are not being met, then one of these variables needs to be adjusted. Typically, the length of the grazing period or number of animals is adjusted. For assistance in calculating the stocking rate, refer to NDSU Extension’s “Determining Carrying Capacity and Stocking Rates for Range and Pasture in North Dakota (www.ag.ndsu.edu/publications/livestock/determining-carrying-capacity-and-stocking-rates-for-range-and-pasture-in-north-dakota) or download the NDSU Grazing Calculator app.
This section describes animal unit exchanges for stocking rates (Figure 10). An animal unit month (AUM) is the forage needs of a 1,000-pound cow-calf pair for one month. An animal unit equivalent (AUE) is based on the type and weight of your livestock and their forage requirements in comparison with the standard AUM. To calculate the existing stocking rate of a pasture, use the formula in this section and input the AUE for the class of livestock from Table 4.
|
Table 4. Evaluating Existing Stocking Rate3 |
|||
|
To determine existing stocking rates in animal unit months per acre (AUMs/ac), use the formula below with the animal unit equivalent (AUE) chart. Adjust the AUMs/ac based on utilization and objectives. |
|||
|
# animals x AUE x days grazed ÷ 30.5 days per month # acres in the pasture |
|||
|
|
AUE |
|
AUE |
|
Cow-calf – 1,000 lb. |
1 |
Ewe |
0.2 |
|
Cow-calf – 1,200 lb. |
1.15 |
Yearling lamb |
0.15 |
|
Cow-calf – 1.400 lb. |
1.29 |
Bison cow |
1 |
|
Yearling - 650 lb. |
0.6 |
Bull |
1.35 |
|
Yearling - 850 lb. |
0.8 |
Horse |
1.25 |
3Adapted from NRCS National Range and Pasture Handbook (1997)
Estimating Utilization of Native Rangeland
Producers and other land managers can gain important information from the visual appearance of a range or pasture. This section highlights an assessment tool used to visually estimate utilization on native rangeland (Table 5). This method can be utilized in combination with calculating utilization of key species in determining utilization of native rangeland pastures with diverse plant communities and multiple ecological sites.
Consistent monitoring of pasture and rangeland is a key component of good range management.
Summary
Monitoring utilization of range and pasturelands using the GMS provides a way to assess how much forage livestock and wildlife have consumed. The GMS can assist North Dakota livestock producers and other land managers in monitoring forage for long-term grass production and vitality. For more information on obtaining a GMS, please contact your county Extension office.
|
Table 5. Estimated Utilization of Native Rangeland4 |
|
|
Utilization measures the percentage of annual herbage production that has been removed by weight. Utilization data, along with trend data, climatic information, actual use data and other information, should be used to adjust stocking rates to meet management objectives. |
|
|
Slight to Moderate |
Light to no use of forage. Height of herbaceous plants grazed at 65 percent or less. |
|
Full |
Rangeland appears entirely covered as uniformly as conditions allow. 65 to 80 percent of the height of the palatable herbaceous plants grazed. |
|
Close |
All rangeland shows use and major section closely cropped. Greater than 80 percent of height of key species grazed. Greater than 10 percent of low-value species utilized. |
|
Severe |
Key forage species completely used. Low-value forages are dominant. |
4Adapted from E.J. Dyktserhuis (1951)
This publication sponsored by North Dakota Grazing Lands Coalition.
NDSU Extension does not endorse commercial products or companies even though reference may be made to tradenames, trademarks or service names.


