Quality Forage Series: Interpreting Composition and Determining Market Value (AS1251, Reviewed May 2018)
Availability: Web only
Importance of Forage Quality
Forage quality can greatly influence how animals produce their products. A portion of the performance variation can be explained by the fact that as forage quality decreases, feed intake also will decrease.
In addition, forage digestibility will be reduced. Nonruminant animals such as horses are able to eat larger quantities of poor-quality forages and pass them through the digestive tract faster to compensate for the lower quality.
On the other hand, ruminants cannot alter intake to compensate for poorer-quality forage. The poorer the forage quality, the longer it remains in the ruminant digestive tract, which, in turn, decreases animal productivity. Table 1 shows the effect decreasing quality has on forage intake.

Some of the negative effects of poor forage quality (higher neutral detergent fiber levels) on dry-matter intake may be overcome by grinding or pelleting forages. A number of studies have been conducted that indicate a greater intake of poor-quality forages can be encouraged by such treatment. While intake is increased, digestibility of individual nutrients may be decreased because of a faster passage rate through the digestive tract. Faster passage occurs because of the smaller feed particle size in ground or pelleted forages.
Digestibility, especially of cell wall components, is decreased when forages are ground or pelleted. The overall result of grinding or pelleting forages usually is increased dry-matter intake but decreased digestibility of individual nutrients. In addition, costs are further incurred with the processing and handling of the forage.
Tables 2 and 3 show how animal performance is influenced by forages of different quality.


The quality of forages can have a substantial influence on animal productivity and profits. Some of the production loss due to advancing maturity of alfalfa (poorer quality) may be overcome by reformulating the rations and possibly adding supplements.
However, regaining 100 percent of lost production is unlikely because of reduced intake due to the poorer-quality forages. Even if all the lost production could be regained, higher feed costs would be the likely result.
Forage analysis from a corn silage plot indicated the net energy-lactation values for 16 different hybrids ranged from 0.64 megacalorie (Mcal)/pound of energy to a high of 0.71 Mcal/pound (dry-matter basis). Assuming no difference in intake between the two energy extremes (likely not a correct assumption), the milk yield potential for the higher-energy corn silage would be 11 percent greater than the lower-quality silage. Using the following assumptions, the economic significance of hybrid quality can be shown:
– 25 tons of silage per acre (adjusted to 70 percent moisture)
– 2.5 acres of corn silage per bag of seed corn planted
– milk prices at $12/hundredweight (cwt)
– 0.34 Mcal to produce 1 pound of 4 percent fat-corrected milk (NRC, 1989)
– 40 percent of animal maintenance requirements are supplied by forages
The difference in potential income per bag of seed corn when comparing 0.71 and 0.64 Mcal/pound energy silages is $555.90. If intake is reduced with poorer-quality forages, the economic differences become even larger.
To become more efficient and profitable producers of animal products, all potential tools and information available must be utilized. Forage quality is one of the most important management tools. Producing and feeding the highest-quality forages possible increases animal performance, reduces feeding costs and ultimately results in an increased return on time and dollars invested in forage production.
Interpreting Forage Analysis
Crude Protein (CP)
Laboratories measure the nitrogen (N) content of the forage and calculate crude protein using the formula: CP = percent N x 6.25. Crude protein will include true protein and nonprotein nitrogen. Animals can utilize both types to some degree. Crude protein values give no indication if heat damage has occurred, which may alter protein availability.
Unavailable Protein
A forage analysis report will not always show this value unless heat damage is suspected and the analysis is requested. This value will give an indication if excessive heating has occurred, reducing protein digestibility. All forages have some unavailable protein. This value also may be reported as ADF-N protein, ADF-CP, bound protein or insoluble protein.
Available Protein
In some reports, this value will be the difference between crude protein and unavailable protein. However, some laboratories account for the naturally bound protein found in all forages. This normally bound protein may be up to 12 percent of the crude protein. Laboratories that account for the naturally bound protein will reduce the crude protein value (available lower than crude protein) only when the 12 percent value is exceeded.
Acid Detergent Fiber (ADF)
This value refers to the cell wall portions of the forage that are made up of cellulose and lignin. These values are important because they reflect the ability of an animal to digest the forage. As ADF increases, digestibility of a forage usually decreases. Many of the calculated values appearing on the forage reports are generated using ADF values.
Neutral Detergent Fiber (NDF)
The NDF value is the total cell wall, which consists of the ADF fraction plus hemicellulose. Neutral detergent fiber values are important in ration formulation because they reflect the amount of forage the animal can consume. As NDF percentages increase, dry-matter intake generally will decrease. Many laboratories analyze for ADF but may not include NDF values.
Crude Fiber (CF)
When the crude fiber system was developed, it was thought to represent most of the cell wall portion of the forage. However, researchers later discovered that it did not account for some of the hemicellulose and lignin components. A modified crude fiber (MCF) value, which includes the ash or mineral fraction, is used in some states to evaluate alfalfa. Some laboratories calculate a crude fiber value based on the ADF value.
Lignin
Lignin is a noncarbohydrate substance that is the prime factor influencing the digestibility of plant cell wall material. As lignin increases, digestibility, intake and animal performance usually decrease and the percent of ADF and NDF increase.
Calculated Values
These values are generated from equations that use other data from the analysis of the forage sample. Laboratories are not required to use the same standardized formulas. This makes comparisons among laboratories difficult. Laboratories should be able to provide the source and accuracy of the formulas they use.
Digestible Protein (DP)
This calculated value is generated using some percent of the crude protein value, such as 70 or 72 percent. Other laboratories may use other formulas, such as (crude protein x 0.908) – 3.77. The digestible protein value gives no indication if any heat damage has occurred. It has little practical value in formulating rations.
Digestible Dry Matter (DDM)
This is an estimate of the digestibility of the forage. This value usually is generated from the percent of acid detergent fiber using formulas such as DDM = 88.9 – (ADF% x 0.779). As the percent of ADF increases, the estimated digestibility will decrease.
Total Digestible Nutrients (TDN)
Some laboratories use the same formula to calculate the TDN value as they do the DDM; therefore, the two values would be the same. Other laboratories will use different formulas, such as:
Alfalfa: % TDN = 96.35 – (ADF% x 1.15)
Corn Silage: % TDN = 87.84 – (ADF% x 0.70)
As the percent ADF increases, TDN will decrease.
Net Energy-Lactation (NEL), Net Energy-Maintenance (NEM) and Net Energy-Gain, (NEG)
These net energy values often are calculated from TDN values, which, in turn, are generated from percent of ADF. Examples are:
NEL:
Mcal/pound = (TDN% x 0.01114) – 0.054
NEM:
Mcal/pound = (TDN% x 0.01318) – 0.132
NEG:
Mcal/pound = (TDN% x 0.01318) – 0.459
As the percent of ADF in the forage increases, the net energy values will decrease.
Relative Feed Value
Relative feed value is an index that combines the important nutritional factors of intake and digestibility. It has no units, but the index allows comparisons of legume, grass and legume-grass forages. A forage with an ADF of 41 percent and an NDF of 53 percent has an index of 100. Other forages then can be compared against this value. When a forage has a value above 100, it is not necessarily a superior-quality forage. This is because the ADF and NDF values that generate the value of 100 are relatively high; thus, the forage is not considered any better than average. As the percent of ADF and NDF decrease, the RFV will increase.
NDFD
Digestible NDF (neutral detergent fiber) is the portion of NDF that is digested in the rumen. Two time measurements may be reported on your forage analysis.
1. A 30-hour in vitro digestibility test measures the forage NDF digested or fermented in a glass container containing rumen fluid for 30 hours. Thirty hours represents the normal digestion time for forages in the rumen.
2. A 48-hour in vitro test represents the maximum amount of digestible NDF that will occur. It will be six to eight units higher than the 30-hour test.
Either NDFD test will estimate digestible NDF. A higher NDFD value is desirable because it indicates high-quality forage.
Table 4 lists forage values for 2011 from Dairyland Labs.

dNDF
The amount of digestible NDF in a forage is calculated by multiplying the amount of NDF in a forage (for example 40 percent NDF in alfalfa) times the NDFD or digestible NDF (for example 50 percent NDFD). This alfalfa sample would contain 20 percent dNDF that represents the quantity and quality of NDF in forage.
RFQ
Relative forage quality (RFQ) is a new term and calculation replacing relative feed value (RFV). RFQ is based on the summative energy equation (used in the new Dairy NRC) to estimate digestibility of nutrients contributing to energy and dry-matter intake based on digestible NDF or NDFD. RFQ will have a similar range of values as RFV (80 to 200 points). Using NDFD and the digestible nutrient content of all forage energy sources will evaluate forage quality accurately. Ratings of grass forages will be more correct.
Milk 2000
Milk 2000 ranks corn silage varieties based on the yield, starch content, starch digestibility, NDF level and digestibility of NDF. Two values can be calculated and reported on each corn silage variety.
1. Milk 2000 per ton of corn silage reflecting silage quality expressed in pounds of milk per ton of silage (for example 3,100 pounds)
2. Milk 2000 per acre of corn silage reflects the quality and quantity of corn silage expressed in pounds of milk (for example 28,000 pounds)
Dairy producers may select higher Milk 2000-per-ton varieties for high-producing cows and a higher Milk 2000-per-acre variety for beef cattle, heifers and lower-producing cows.
Net Energy (NE) Lactation
The Net energy lactation content of corn silage is calculated based on a University of Wisconsin equation using dry-matter content starch levels, digestible NDF and starch digestibility. This system reflects the higher energy value of plant-processed corn silage, wetter corn silage and digestible nutrient content.
These new forage values and approaches allow livestock producers to more accurately measure forage quality, balance rations or sell forages based on digestible nutrient content.
USDA Hay Quality Market Reporting Guidelines
If you buy or sell hay and use USDA market reports to establish a starting price in negotiations, the Agricultural Marketing Service (AMS) has adopted hay quality guidelines for use in its Market News reporting program. These revised guidelines establish specific quality measurements for each category of alfalfa and grass hay and are designed to create uniform quality/price reporting nationwide.
The guidelines (Tables 5 and 6) went into effect in 2003. In addition, descriptive guidelines for each quality category also are provided. They include:
• Supreme: very early maturity, pre-bloom, soft, fine-stemmed, extra leafy. Factors indicative of very high nutritive content. Hay is excellent in color and free of damage.
• Premium: early maturity, i.e., pre-bloom in legumes and pre-head in grass hays, extra leafy and fine-stemmed – factors indicative of a high nutritive content. Hay is green and free of damage.
• Good: early to average maturity, i.e., early to midbloom in legumes and early head in grass hays, leafy, fine to medium stemmed, free of damage other than slight discoloration.
• Fair: late maturity, i.e., mid to late bloom in legumes, head-in grass hays, moderate or below leaf content, and generally coarse-stemmed. Hay may show light damage.
• Utility: hay in very late maturity, such as mature seed pods in legumes or mature head in grass hays, coarse-stemmed. This category could include hay discounted due to excessive damage and heavy weed content or mold. Defects will be identified in market reports when using this category.
Quantitative factors are approximate, and many factors can affect feeding value. Factors are based on 100 percent dry matter. Guidelines are to be used with visual appearance and intent of use.


Regular national and regional hay market summaries are available.
Adjusting the Price of Forages
Based on Dry-matter Content
Wet feeds, such as silages, that are bought or sold should have the price adjusted to a common dry-matter content to ensure that a fair price is being paid for the feed. Enough samples should be taken so accurate dry-matter determinations can be made.
In a corn-silage harvest at a major university, 18 loads were harvested from an eight-acre field. Each load was sampled to determine the percent of dry matter, with the average of all loads being 30.97 percent. Samples ranged from a high of 33.6 percent to a low of 28.3 percent dry matter. If the silage was sold based only on the high sample, the tonnage would have been overestimated by 8.7 percent. If the low moisture content sample had been used, the yield would have been underestimated by 8.4 percent. In either case, it would have been economically significant.
When adjusting silages, any dry-matter content can be used, but adjusting silages to either 30 or 35 percent dry matter is common. In the following examples for pricing forages, adjustments to a standard of 35 percent dry matter have been made. If different dry matter levels are used, the pricing procedure would be the same.
Assuming $31.50/ton as a fair price for 1 ton of silage at 35 percent dry matter (DM), the following examples show how the price per ton will fluctuate as dry matter varies. Note that 1 ton of silage at
35 percent dry matter has 700 pounds of dry matter (2,000 x 0.35 = 700 pounds of dry matter).
Example A:
Sample is 23 percent dry matter:
Adjusted price = ($31.50 ÷ 35) x (? ÷ 23)
35 x ? = ($31.50 x 23)
? = 724.5 ($31.50 x 23) ÷ 35
? = $20.70 per ton of silage with a DM content of 23%.
Note that less is paid per ton because the amount of dry matter is smaller (2,000 x 0.23 = 460 pounds of dry matter).
Example B:
Sample is 38 percent dry matter.
Adjusted price = ($31.50 ÷ 35) x (? ÷ 38)
35 x ? = ($31.50 x 38)
? = 1197 ($31.50 x 38) ÷ 35
? = $34.20 per ton of silage with a DM content of 38%.
Note that more is paid per ton because this sample has more dry matter (2,000 x 0.38 = 760 pounds of dry matter).
One very important rule is to make sure the value per ton is compared on the dry-matter content in that ton, not the moisture! All price adjustments should be made using the dry-matter content.
Example:
Calculate using $31.50 ÷ 35 (percent of dry matter), do not use 65 (percent moisture)
In all three cases, the price paid per ton of dry matter should be the same.
$31.50 at 35% dry matter = $90 per ton of dry matter: ($31.50 ÷ 0.35)
$20.70 at 23% dry matter = $90 per ton of dry matter: ($20.70 ÷ 0.23)
$34.20 at 38% dry matter =$90 per ton of dry matter: ($34.20 ÷ 0.38)
Pricing Haylage
To calculate the price to be paid for haylage, based on the price of dry hay, the procedure is the same. The factors involved are:
1. The value of dry hay (of similar quality)
2. The dry matter content of hay at that price
3. The dry matter of the haylage being purchased
Example:
What is the price per ton for haylage if:
Value of hay at 85% dry matter = $90 per ton.
(90 ÷ 85) x (? ÷ 33) =
2,970 [90 x 33] ÷ 85 = $34.94
Table 7 gives the value of haylage at 30 percent dry matter as the price and moisture of baled hay vary. The values do not reflect any harvest or storage losses and assume equal quality forge.

The value of the haylage would change if the dry matter content is higher or lower than 30 percent. Price per ton can easily be calculated using the formulas in this section.
Note: If the dry matter content of the forage being bought deviates significantly (very wet or dry) from normal ranges, additional evaluation should be made to determine if quality has been lowered. If it has been lowered, an additional price adjustment will be necessary.
Likewise, Table 8 shows the adjusted value of corn silage from 25 to 45 percent dry matter.

Relative Economic Value
A primary use of alfalfa hay test information is in formulating rations. Because alfalfa makes up a major portion of the rations fed to livestock, knowing its nutrient content is important to ensure that it is supplemented with the right type and amount of other feedstuffs for a properly balanced ration.
Another use of the data is to determine the relative economic worth of different alfalfa lots.
The energy value and DM content of the sample are important for estimating its economic value.
When hay is selling for $120 per ton, 1 percent moisture costs the buyer $1.20 per ton. Most hay will standardize at about 90 percent DM (10 percent moisture) after being stored for a month or so in warm, dry weather. When hay is bought soon after baling, moisture levels of 15 to 17 percent are common. The buyer should consider the decreased value of high-moisture hay as well as its energy value when negotiating the price.
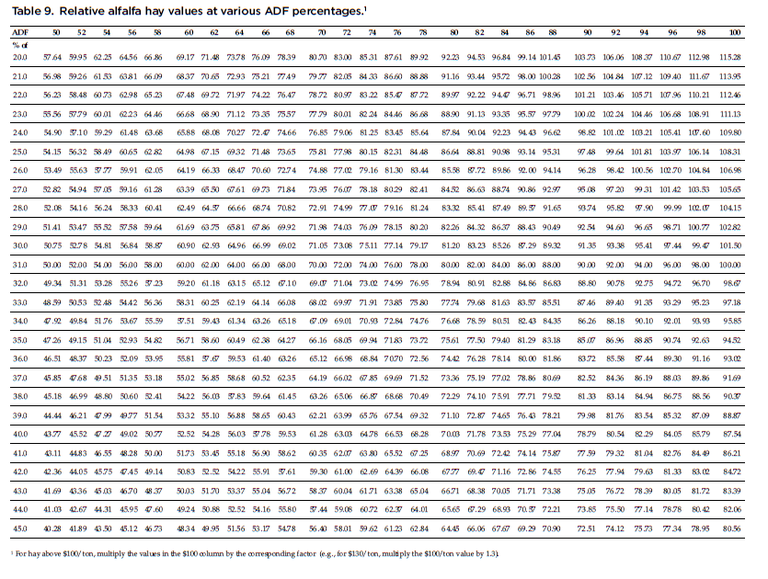
Tables 9 and 10 can be used to estimate the relative dollar values of alfalfa lots at varying ADF and DM percentages. The tables are based on a standard hay sample arbitrarily set at 90 percent DM and 31 percent ADF (Table 9) (on a 100 percent DM basis). After the chemical composition of the sample is determined, use Tables 9 and 10 as follows:
• From the left column of Table 9, find the row with ADF percentage of the alfalfa sample.
• Read across that row to the column headed with the dollar value closest to the price of standard hay (90 percent DM and 31 percent ADF). Where the row and the column intersect, you will find the corrected value of the tested hay.
• From the left column of Table 10, find the DM percent of the tested hay.
• Read across to the right column for the DM correction factor.
• Multiply the ADF value from Table 9 by the DM correction factor from Table 10 to estimate the value of the tested hay relative to the standard hay.


Example
What is the relative value of alfalfa hay with 28 percent ADF (100 percent DM basis) and 85 percent DM (as received) when standard hay is selling for $87.50 per ton? In the left column of Table 10, find the row for 85 percent DM. Read across to the right column for the DM correction value – in this case, 0.9444. Multiply the ADF corrected value ($91.65) by the DM correction factor (0.9444) to get the approximate value of the tested hay, $86.55.
This method is not intended as a guide for pricing hay. Prices are established by supply and demand. Rather, it is intended as a way to compare the values of different hay lots whose sale prices have been stated.
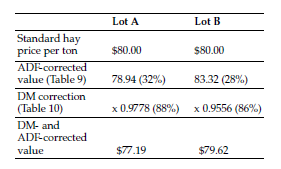
For example, a dairy operator is offered two lots of hay, each at $79 per ton. Good-quality hay is selling for $80 per ton on the open market. Lot A has 32 percent ADF (100 percent DM basis) and 88 percent DM as received at the laboratory. Lot B has 28 percent ADF (100 percent DM basis) and 86 percent DM. Which is the better buy? Using Tables 9 and 10, the following comparison determines the relative value of the two lots.

The above calculations indicate that Lot B is worth more per ton than Lot A by $2.43 ($79.62 – $77.19 = $2.43). The dairy operator would do better to purchase Lot B if both were priced at $79 per ton.
Valuing Forages Based on Moisture
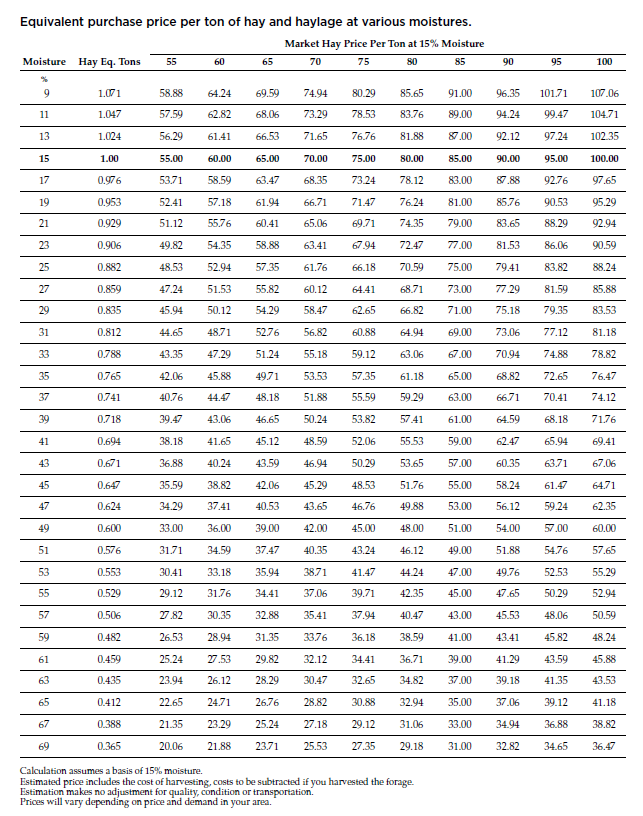
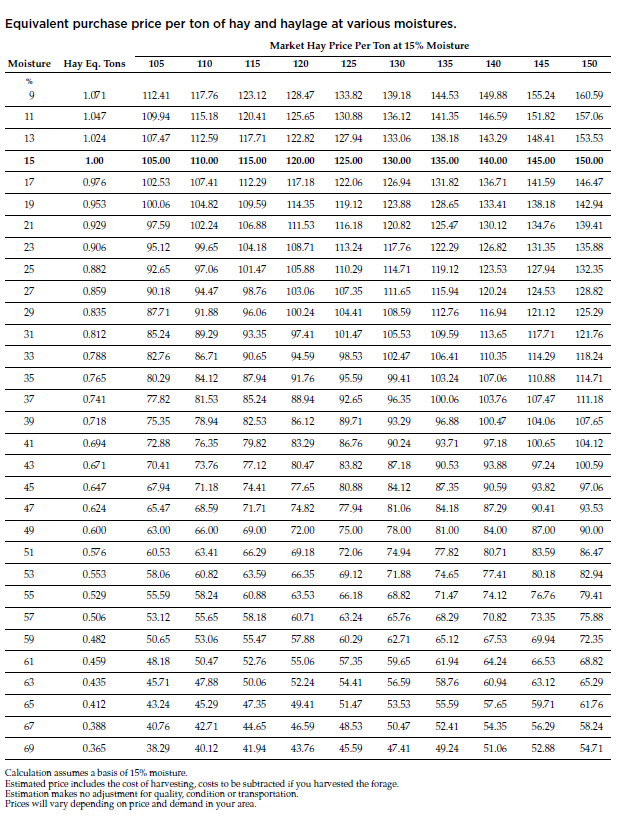
Even good-quality forage will vary on moisture content. Upon determining a fair market priced based on relative feed quality and nutrient content, be sure to correct for moisture content. The following table is provided for your convenience. It has a limited price range and is based solely on 15 percent moisture hay and haylage as the standard. You can create your own table using an electronic spreadsheet and your own calculations.


References
In addition to sources cited, materials were adapted with permission from Pioneer Forage Manual, which no longer is in print and the Illini DairyNet website.
This publication was authored by J.W. Schroeder, former dairy specialist, NDSU, 2006.

Revised May 2018

