Site-specific Farming: Developing Zone Soil Sampling Maps (SF1176-2, Revised March 2018)
Availability: Web only
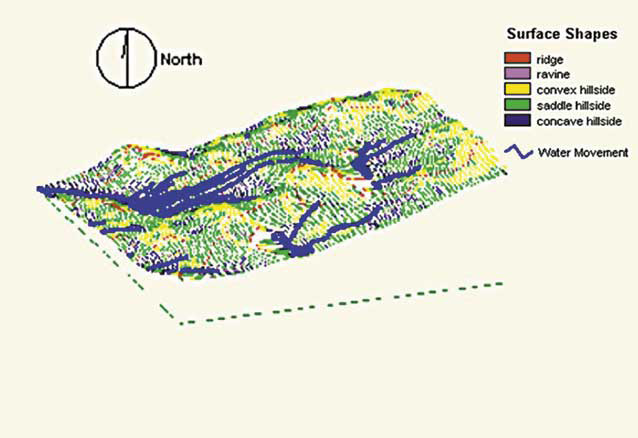
Elevation data modeled into surface shapes using IDRISI (Clark Labs) on a 40-acre field near Valley City.
Zone soil sampling has been very effective in revealing residual nitrate patterns and amounts in fields
In the northern Great Plains region, most soil sampling is conducted to determine the residual soil nitrate (N) available following a previous crop that can be used to reduce the N fertilizer required for the next crop. Zone soil sampling has been very effective in revealing residual nitrate patterns and amounts in fields. To develop zone boundaries to direct soil sampling, a number of tools can be used. A regional project in North Dakota, Montana and Minnesota concluded that all the tools detailed here can be used to develop zones.
Topography
Topography is a landscape surface derived from elevation data. The elevation data may come from actual surveys of the landscape with a laser transit, or from LIDAR (light detection and ranging) data or RTK (real-time kinetics)-GPS (global positioning satellite) signals. Ideally, the zones developed with the elevation data would be separated into features that people identify when they look at landscape: hilltop, ridge, shoulder slopes, convex/concave slopes, foot slopes, depressions. Most current GIS (geographic information systems) mapping options do not cluster the data into these “people-friendly” features. Models used most often are watershed models or slope gradient models. These have been used with some success; however, comparing the results with a surface map and the processor’s visual interpretation of the surface map and choosing the model that best fits is recommended.
Topography influences the presence of residual nitrate and other nutrients in the region due to denitrification and water movement over and through our soils. Nitrate tends to accumulate in some areas and either is removed by crops due to exceptional grain production or is leached from other soils due to landscape position and the tendency in some fields for ridges and hilltops to be coarser in texture than depressions. North Dakota phosphate and potassium application recommendations have been based on the sufficiency approach rather than the corn belt maintenance-buildup approach, so few fields have been overfertilized during the last 50 years. This approach also has resulted in a high relationship between landscape position and nonsoil mobile nutrient content.
Remote imagery and remote sensing
Satellite images of growing crops can be accessed easily for nearly all regional fields. For zone delineation, having the image from the latest year is not important, However, choosing an image from a year that is characteristic of a particular growing season is important. The NDVI (normalized differential vegetative index) band from the satellite in a growing crop at a time when the rows are closed until directly before flowering is a good time to use. For small grains, this is usually late June; for corn, it is mid-July; for potato, it could be late August; for sugar beets, it is mid-September before preharvest. Satellites with 10 meter (m) to 30 m resolution have been effective in developing meaningful zones. Aerial photography also can be used, but finding a pilot who is willing to take the right kind of picture in midsummer is often difficult. For an 80-acre field, the picture should be taken from 5,000 feet above the soil surface and the camera should point straight down (nadir). An aerial photograph sometimes can be too fine in resolution and the resulting zones can be too detailed. Since most application equipment is going to apply product in swaths from 60 to 100 feet, resolutions that are too detailed can result in complex and impractical application maps.
Hand-held active optical sensors are also available and can be attached to an agricultural sprayer or cultivator tool and image data can be obtained during a normal field operation. These sensors result in maps that are finer resolution compared with a 30-m satellite image, but not as fine as an aerial photo. The advantage of these sensors is that they provide the same data with full sun as they would in the dark. Clouds passing by do not change the data acquired.
Sensors are being developed to allow their site-specific placement in certain field locations at the soil surface or within a crop canopy. Signals from these sensors can be transmitted via within-field repeater stations to a grower computer for real-time spatial sensing of micro-climatic measurements, such as canopy humidity and temperature levels, that might be important to initiate site-specific fungicide application, for example.
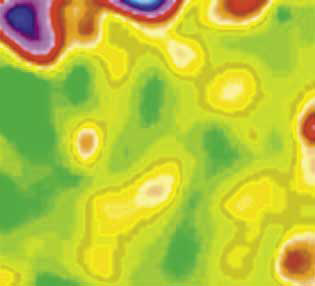
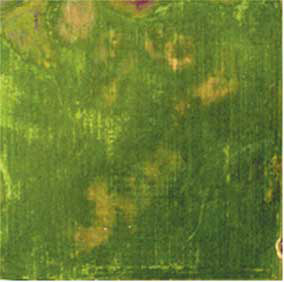
Satellite image of field near Valley City using Landsat 5 (left) or aerial photography (right).
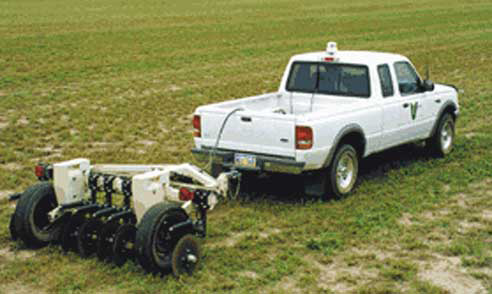
Veris soil EC sensor. (Photo courtesy of Veris Technologies, Salina, Kan.)
Electrical conductivity and magnetic flux sensors
Soil electrical conductivity (EC) or soil electromagnetic (EM) sensors have been used to develop nutrient and crop management zones successfully. They rely on the properties of soils and nutrients that relate to electrical conductivity through soils. An electric current will travel through soil, as any good insurance claim agent knows through lightning strike claims. Soil properties that increase conductance are higher clay content, higher soil moisture, higher organic matter, higher soluble salt content and higher nutrient content. The U.S. has areas where soil EC measurements are directly related to certain soil features. Some areas in Missouri have a restrictive silicate-bound soil layer called a fragipan. Depth to the fragipan can be estimated using a soil EC sensor because other soil properties that might interfere with the depth measurement are relatively low and insignificant. In the southeastern coastal plains, where soil is a swirl of sands and heavier textures that influence crop productivity, organic matter and soluble salts are low and the textures can be mapped using a soil EC sensor. In North Dakota, we have high salt sands, low salt sands, high salt clays, low salt clays, and high and low organic matter in each category and the sites may or may not be wetter at the time of sensing. Use of a soil EC sensor is therefore a good pattern detector but is generally not related to one soil feature.
Soil EM sensors work because magnetism and electricity are mathematically related. Soil properties that affect soil electrical conductivity also affect magnetic flux in a similar fashion. In studies comparing the two sensors, the resulting maps are very similar in pattern. The EM sensor is preferred when significant rocks are present or in a standing crop, or when the field is too wet to pull a soil EC across the field.
Yield frequency mapping
Patterns of crop yield can be an important tool in delineating crop and nutrient management zones. Use of one year’s yield map is discouraged because weather or other spatially important factors might not occur in the same pattern every year. One year, a part of the field might flood, and the next year it might be most productive. One year, a part of a field might be very droughty, while the next year it might be as productive as any other part of the field. To provide a better perspective for zone management of the field, use of multiple years of maps is most helpful.
The method of developing a yield frequency map is outlined in NDSU Extension publication SF1176-3. Generally, to produce a yield frequency map, more than one year’s yield using a combine/harvester yield monitor is required. You do not need to have the same crop each year. A crop sequence of corn, soybean, wheat and sunflower might be used; or canola, durum, spring wheat, winter wheat. Any crop sequence may be utilized in the development of a frequency map. Most site-specific consultants understand how to construct a yield frequency map. Briefly, the cleaned-up yield data for a field is averaged within an arbitrary grid. This is done using the same grid for each year of yield data. If within a year the averaged value within the grid is above the average of the field, the grid is given a value of +1. If it is within a bushel of average for the field, it is given a value of 0. If the grid is lower than average, it receives a -1. Using Excel or a similar spreadsheet, the multiyear values for each grid are added and the result is a grid representation of the entire field through time. The resulting map will show areas that are nearly always high-yielding or low-yielding, and areas of variable yield. These maps will help direct soil sampling, but also may help define productivity of areas of the field.
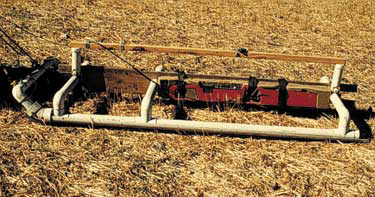
EM-38 being used on a PVC sled near Valley City, N.D.
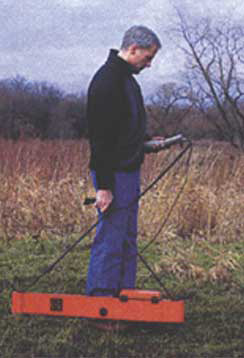
EM-38 in use. (image courtesy of Geonics Inc., Mississauga, Ont.)
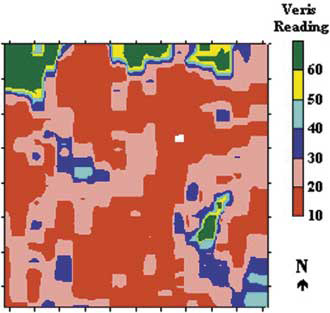
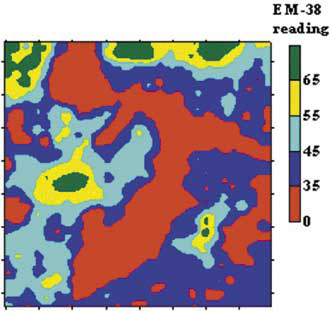
Soil EC sensor patterns (top) compared with soil EM patterns (bottom) on the same field near Valley City, N.D.
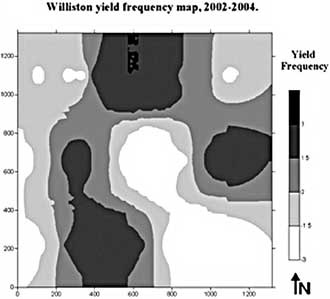
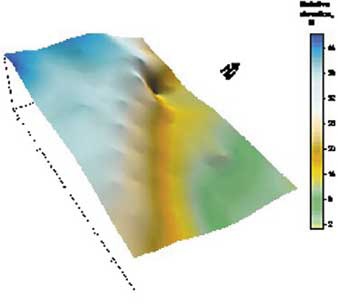
Williston yield frequency map from spring wheat data (left). Low yielding areas are on steep, eroded slopes (elevation map at right). Higher yielding areas are on higher organic matter soils that are relatively level.
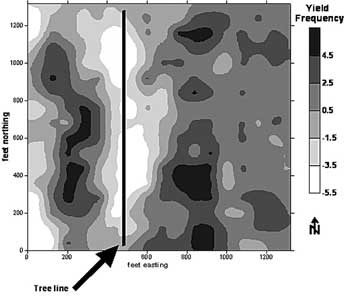
Yield frequency map of a long-term corn/soybean rotation in Illinois showing the effect of tree row on long-term yields. (from Franzen, 2008. NDSU Tech. Bulletin - Summary of 40 years of grid sampling in Illinois).
Grower knowledge
A consultant commonly has the grower view the resulting zones before committing to their use for crop management. If the grower has been working a farm for several years, he/she will recognize the zones immediately and may comment on experiences in each one. Sometimes, however, the grower may believe that perhaps there are too many zones, or perhaps something is missing that he/she might be able to add to the map. Work in Colorado has shown that grower input is critical to the successful implementation of zone nutrient management.
Digital soil maps
Digital soil maps of most fields in North Dakota are available using the Web soil survey tools online; however, the resolution of these maps is generally not fine enough to be seriously considered for zone management of production or nutrients. An exception to this may be in the inter-beach area west of the Red River Valley, where in most counties, the sandy ridges of importance to growers are well-defined on the digital maps. The U.S. Department of Agriculture-Natural Resources Conservation Service is making an effort to improve the resolution of these maps using several of the tools referred to in this publication; however, revised maps are years away.
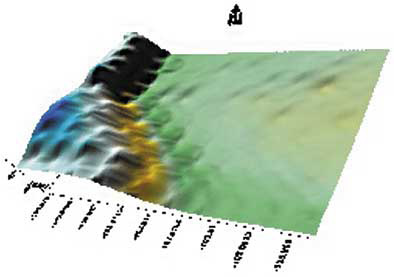
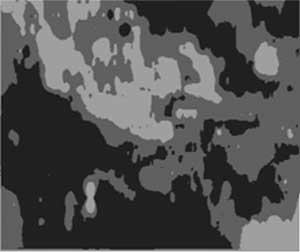
Elevation map of a 30-acre field near Beach, N.D. (top). Same field using watershed modeling within ArcGIS combined with satellite imagery (bottom) using Erdas Imagine software. The satellite imagery reveals more complexity in zone structure than topography alone. Soil EC agrees with the combined image.
Development of zone maps
Zone maps have been most related to soil nutrients and crop productivity when more than one tool is used to develop the final zone map. The tool most often related to residual soil nitrate has been topography from eastern Montana to central Minnesota. Other tools in order of usefulness have been satellite imagery and yield frequency maps. Soil EC has been most useful in the west, in coarser-textured fields irrigated or dryland, and in fields with significant salinity problems.
Multizone maps are produced by first producing individual zone maps of each tool data base for the field. A layering program then is used to superimpose the value and location of each zone map pixel geographically over the corresponding pixel of the other zone map(s). A clustering program then is used to analyze the patterns from each zone map to produce the final multizone map.
Choice of zone number is largely left to the consultant or grower. Usually three to five zones for fields from 40 acres to 640 acres are selected. Up to 10 zones have been used to manage a field in extreme cases. There is no absolutely correct number without knowing the underlying spatial character of the field at a very specific level. The developer and end user need to understand that zones are useful to improve management of the field from the present state of uniform management, but that small-scale variability may need to be addressed using additional methods in the future if agronomics and economics of the procedures and tools to achieve them are compatible.
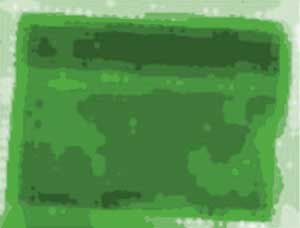
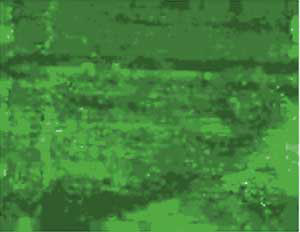
Sugar beet field image of crop in August using Landsat image (top) and an October image using NDVI data from a Greenseeker sensor attached to the sugar beet defoliator the date of harvest (bottom). Note that a large area of varietal difference can be seen at top of each figure, but small-scale differences in the bottom are difficult to distinguish with the satellite image. Images courtesy of Gary Wagner, Climax, MN
Reviewed and reprinted March 2018


