Site-specific Farming: Economics and the Environment (SF1176-4, Revised May 2018)
Availability: Web only

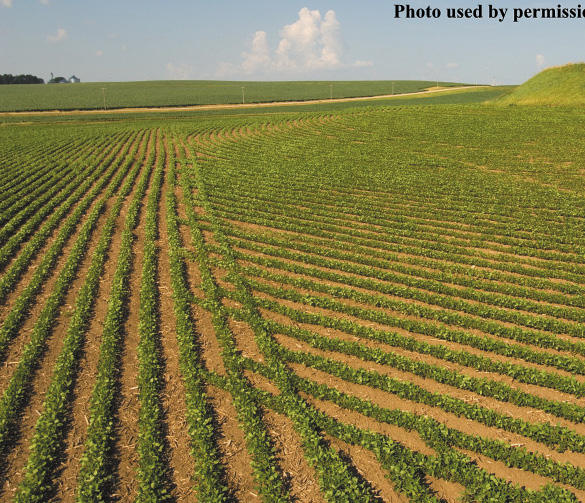
Field seeded with swath control. Note small amount of overlap into end rows. (Photo used by permission from John Deere)
Site-specific farming is doing the right thing at the right place at the right time. Site-specific farming systems can be as simple or complex as required by the farmer or farm input supplier.
Economic returns to the grower from site-specific technologies depend on the tools used and the scale of the system. GPS-linked guidance tools and identity-preserved (IP) locations are whole-field scales. The use of yield monitors, zone soil sampling, variable-rate fertilizer or variable-rate seeding is within-field scale.
Economics and environmental effects usually are not linked. However, due to future government policies, economics and the environmental effects of farming are more connected today than in the past.

Surface water can be impacted negatively by poor phosphate and nitrogen fertilizer management. (Dave Franzen, NDSU)
GPS-linked Tractor/Vehicle Guidance
GPS-linked guidance systems can reduce fertilizer/pesticide overlap during application, increase speed of operations, offer greater flexibility in labor quality, extend the workday and result in more optimum input placement (Griffin et al., 2008). In a case study of guidance systems, Griffen et al. (2008) found that a three-hour extended workday from a guided tractor resulted in an additional $1.63/acre return.
The guidance systems also helped plant fields in the most efficient manner with minimal overlap, reducing planter time by 30 percent, estimating 10 percent overlap with the planter, fertilizer applicator or pesticide spray applicator, but overlap was reduced to 0.5 percent using the guidance system.
The time saved with the use of tractor guidance could be used to finish planting earlier, which in corn has been shown to increase yield by one bushel/acre per day, or the extra time might be considered in the decision to farm more acres.
Overlap is possible between passes (22 passes in a square 40-acre field with 10 percent overlap in 30-inch rows of about 0.5 acre overlapped per field) and also at each end of the field (1,320 feet with 6 feet overlap at the ends results in about a 0.36 acre overlap in a 40-acre field). Total overlap in a square field typically is about 0.86 acre, or about 2 percent extra seed, fertilizer and pesticide required.
The use of these systems to reduce overlap would result in input cost savings of $1/acre for soybean, $2/acre for dry bean, $2.50/acre for wheat (Swenson and Haugen, 2009) and more than $4/acre for corn and sugar beet.
In fields that are not square or have internal features that force farmers to farm around them, such as rock piles, water potholes and waterways, overlap may increase inputs by as much as 15 percent. A recent survey of U.S. farms by the U.S. Department of Agriculture indicates a 2.5 percent greater profit for farmers using GPS guidance systems, compared with farmers who do not use GPS guidance (Schimmelpfennig, 2016).
Environmentally, reduction in overlap has the benefit of reducing total fertilizer and pesticide load by about 2 percent in square fields and more in odd-shaped fields, fields with point-rows and fields with potholes or other internal features that require driving around.
Individual sprayer shut-offs that are GPS-controlled are available. They eliminate overlap in odd-shaped areas while spraying pesticides or liquid fertilizers.
Swath control (Shockley et al., 2008) reduced input costs much more than guidance systems alone in irregular-boundary fields. Savings in fertilizer alone due to individual nozzle shut-offs ranged from $24 to $32/acre.
Identity Preserved (IP)
GPS and GIS mapping are used in contracting and marketing of IP grains (North Dakota State Seed, 2008). Because field operations guided by GPS also are linked with the GPS locations within each field boundary, GIS provides an opportunity to create a record of field operations for each IP field.
Premiums for certain crops are provided through contracts that range from $1 to $2/bushel for non-GMO soybeans. A discussion of IP in North Dakota is provided by Dahl and Wilson (2002).
Environmentally, keeping spray application GPS records helps verify the application. This information is particularly important when restricted-use pesticides are applied.
In addition, GPS information regarding a spray application may be extremely useful in spray drift or spray volatility litigation (for and against a plaintiff), as well as for directing the sprayer to the correct field location and avoiding application to the wrong field and crop. Avoiding a single load of pesticide or fertilizer applied to the wrong field may result in savings to the applicator of from a few to many thousands of dollars.
Variable-rate Fertilizer
The purpose of variable-rate fertilizer is to place fertilizer where it is needed. One would think that many examples of profitability with the use of variable-rate fertilizer would exist.
In a three-state project conducted in North Dakota, Montana and Minnesota from 2000-2003, fields were divided into variable-rate and uniform-rate plots with respect to nitrogen (N) fertilizer. An economic analysis of the fields found that by using the fertilizer recommendations available at the time in a zone approach, variable-rate N provided no economic advantage, compared with uniform-rate N directed by a composite soil test (Haugen and Aakre, 2005).
These results spurred research into updating N recommendations based on our present ability to vary rates within fields. In Montana, research quickly showed that the areas with higher organic matter on lower slopes did not respond to N; this meant that minimal supplemental N was required, even if soil N levels were low. In contrast, lower-yielding areas on hilltops and eroded slopes required more N per productive bushel than previously expected.
Present fertilizer recommendations in North Dakota are not yield-based formulas because the research indicates that similar rates of nutrients are required whether a crop is grown in a low-yielding environment or a high-yielding environment. This is due to the low nutrient uptake efficiency and low availability in very dry or very wet soils, compared with the high nutrient uptake efficiency and availability in high-yield environments.
The next page is a case study of a 40-acre field near Valley City, N.D., that was examined site-specifically for about 10 years.
Environmental Economics
In the Valley City case study, the use of variable-rate N application reduced N in Zones 1 and 2. If the crop did not use the N, where did it go?
The N cycle is complex. About one-half of the N fertilizer, at best, went into the wheat crop and the rest of the wheat uptake was from soil and residue N release.
Also, some of the fertilizer was sequestered at least temporarily in microbial biomass or intermediate organic matter compounds; however, less was applied to Zones 1 and 2 in the variable-rate system than the uniform-N system.
Cleanup of nitrates documented in Khan and Spalding (2004) cost about 16 cents/1,000 liters for about 12 parts per million (ppm) of groundwater to be reduced below 10 ppm under a municipality in Nebraska. This is about 16 cents/2 grams of N. If the amount of N entering a groundwater aquifer contributed to nitrate levels higher than 10 ppm (the U.S. Environmental Protection Agency’s maximum drinking water standard), then cleanup of 500 pounds of N that went into the aquifer would be $18,160.
In addition, Zone 1 is a wet area, with denitrification in wet years and significant N mineralization in other years. Extra N applied to Zone 1 will denitrify. Also, extra N applied to Zones 3 and 4 tends to flow into Zone 1 through subsurface water flow and then is denitrified.
If 10 pounds of N/acre from Zones 3 and 4 flowed into this area and 50 pounds of N/acre also was denitrified after application within Zone 1, a total of 420 pounds of N in the field would be denitrified.
Because nitrous oxide is rated 310 times as active as a greenhouse gas, compared with carbon dioxide (CO2), the effective CO2 loss would be 130,200 pounds, or 65 tons. Carbon gains or losses from a field have no economic value; the Chicago Carbon Exchange program was discontinued in 2010.
CASE STUDY
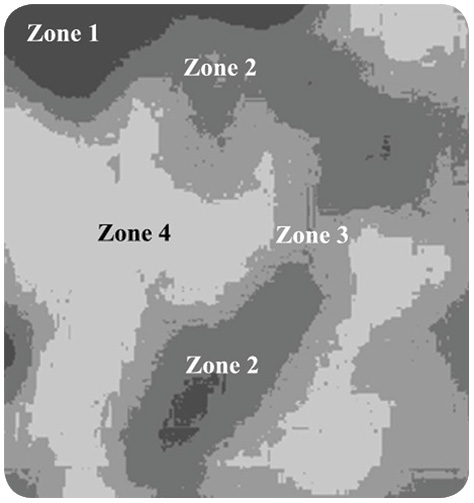
The acreage components of each zone (Figure 1) are:
Zone 1 – depressions, 4.5 percent organic matter poorly drained soils, 3 acres; low productivity
Zone 2 – sandy or loamy ridge tops, 2.5 percent organic matter; low productivity; 10 acres
Zone 3 – high-yielding loam soils, 3.5 percent organic matter with argillic subsurface horizon that limits leaching; high productivity; 16 acres
Zone 4 – highest-yielding loam soils, 4 percent organic matter with argillic subsurface horizon; 11 acres
The composite fall nitrate-N sample value is 40 pounds of N per acre after barley. Using the spring wheat N calculator at www.ndsu.edu/pubweb/soils/wheat/, at $5 per bushel for spring wheat and 40 cents for N costs, medium productivity, the N rate for the 40-acre field would be:
50 pounds of N/acre, for a total N required of 2,000 pounds
A zone sampling for residual nitrate-N resulted in the following nitrate-N values:
Zone 1 – 20 pounds of N per acre
Zone 2 – 30 pounds of N per acre
Zone 3 – 40 pounds of N per acre
Zone 4 – 60 pounds of N per acre
Variable rates for zones based on the N calculator, $5 per bushel spring wheat, 40 cents N:
Zone 1 – 10 pounds of N/acre (30 pounds of N for entire zone)
Zone 2 – 0 pounds of N/acre
Zone 3 – 130 pounds of N/acre preplant (2,080 pounds of N for entire zone)
Zone 4 – 110 pounds of N/acre preplant (1,210 pounds of N for the entire zone)
Total N used – 3,320 pounds
Based on the spring wheat yield response equation for eastern long-term no-till, medium productivity fields, the following would be expected with each system:
Uniform N – 13.8 percent protein, 47 bushels per acre
Variable-rate N:
Zone 1 – 14 percent protein, 30 bushels per acre
Zone 2 – 14 percent protein, 30 bushels per acre
Zone 3 – 14.5 percent protein, 62 bushels per acre
Zone 4 – 14.5 percent protein, 65 bushels per acre
Average yield – 52 bushels per acre
Average protein – 14.3 percent
Economically, the cost of N at 40 cents per pound is:
$800 for uniform
$1,328 for variable plus $40 for an extra stream-bar application
Total variable rate cost – $1,528
Return for uniform application:
47 bushels per acre at 13.8 percent protein
X $4.95 per bushel = $9,306
Less cost of N – $8,506
Return for variable-rate application:
52 bushels per acre at 14.5 percent protein
X $5.10 per bushel = $10,608
Less cost of N and extra application charge – $9,080
Profitability from variable-rate N application
– $574 for 40-acre field
Per-acre profitability vs. uniform application – $14.35
Environmentally, expected residual N would be greater in zones 1 and 2 for the uniform application, compared with that of the variable-rate application rates.
In a Colorado study, Koch et al. (2004) found in irrigated corn that zone-directed N required from 6 to 46 percent less N, and net returns ranged from $7/acre to $11.60/acre for the practice. In the USDA survey of U.S. farmers, the use of variable-rate fertilizer resulted in 1.1 percent greater return for farmers using the technology than those that did not (Schimmelpfennig, 2016).
In the Red River Valley of North Dakota and Minnesota, variable-rate fertilizer application was used on nearly 54 percent of sugar beet acres, with the 10-year average per acre profit from the use of variable-rate fertilizer application (mostly N) of $47.24. (American Crystal Sugar data provided, 2017).

Figure 1. A 40-acre field near Valley City, N.D. The zones were developed using Erdas Imagine© to layer and cluster topography, satellite imagery and soil electrical conductivity (EC) data. (Dave Franzen, NDSU)
Variable-rate Seeding
Many growers are interested in varying the seeding rate across variable-soil fields. The idea seems sound. Too high a plant population of most crops in droughty soils is detrimental in dry years. However, work in the Corn Belt has shown that despite what growers think they know, optimum plant populations of modern corn hybrids fall into a very narrow range from about 26,000 to 30,000 plants/acre. (Doerge).
This range assumes that corn will emerge similarly on all soils, which is not true. Harvest stand counts show a large range of variability. Even though the field was seeded at a uniform rate, that does nott mean the stand is uniform.
Seed company emphasis is on seed uniformity and stand establishment success. However, a relationship exists between stand density and final yield, indicating that relative yield within a field might be a factor for directing a variable-rate seeding operation (Jeschke et al., 2018).
Additional Environmental Benefits
A review by Bongiovanni and Lowenberg-Deboer (2004) outlined a suite of findings by researchers of environmental benefits for site-specific management of fields. These include:
- Less N lost to the environment and greater nitrogen use efficiency
- Less N loss in zones vulnerable to leaching
- Reduced N rates
- More accurate prediction of P pollution potential
- Reduction of P movement into surface waters
The potential for site-specific agriculture to increase profitability and decrease environmental concerns has long been acknowledged. Recently, studies have shown that with updated fertilizer recommendations, the use of site-specific fertilization often is profitable.
Contributing to the profitability is the increased costs of fertilizer inputs. A number of environmental benefits also have been shown due to the improved placement of nutrients and decreased need for growers to add “insurance” fertilizer rates on fields.
Excessive groundwater nitrate cleanup around municipalities also may push the profitability of site-specific nutrient use as economics and the environment become more closely related through public policy changes. The emerging phosphate run-off rules may result in a greater requirement and need for site-specific technologies.
Overall Economic Benefit
The conclusion of the USDA survey of U.S. farmers (Schimmelpfennig, 2016) was that farmers who used at least one site-specific technology were $64.50 per acre more profitable than farmers who did not. In North Dakota, the return was $88.10 greater profit for farmers using precision farming technologies than those who did not.
Perhaps farmers who used site-specific technologies in North Dakota and the U.S. as a whole might be a group of farmers who make more timely planting and pesticide application decisions, better management decisions or better marketing decisions. Those confounding factors are not considered in the survey.
The greater profit for North Dakota farmers may be due to the volume of site-specific research directly applicable for growers in this state and the development of fertilizer recommendations that have the greatest practical use when combined with site-specific application. The crop choices in this state also are more suited to variable-rate fertilizer application than a simple corn/soybean rotation.
Spring wheat, durum, sugar beet, potato, sunflower and malting barley have quality components that are related to N rate in particular, which provide an incentive to not overapply N and other nutrients, which is not as much concern for corn.
References
Bongiovanni, R., and J. Lowenberg-Deboer. 2004. Precision agriculture and sustainability. Precision Agriculture 5:359-387.
Dahl, B.L., and W.W. Wilson.2002. The logistical costs of marketing identity preserved wheat. NDSU Agribusiness and Applied Economics Report No. 495. (Accessed April 2018).
Doerge, T. New opportunities in variable-rate seeding of corn. Pioneer Growing Point
Griffin, T., D. Lambert and J. Lowenberg-DeBoer. 2008. Economics of GPS-enabled navigation technologies. Proceedings of the 9th International Conference on Precision Agriculture. July 20-23, Denver, Colo.
Haugen, R.H., and D.G. Aakre. 2005. Analysis of soil fertility testing procedures using uniform, topographical and other site-specific methods. Agribusiness and Applied Economics Report No. 570. North Dakota State University, Fargo, N.D.
Jeschke, M., P. Carter, P. Bax and R. Schon. 2018. Putting variable-rate seeding to work on your farm. Pioneer Agronomy On-Line Library, Pioneer Hi-Bred Int., Johnston, Iowa.
Kahn, I.A., and R.F. Spalding. 2004. Enhanced in situ denitrification for a municipal well. Water
Research 38:3382-3388.
Koch, B., R. Khosla, W.M. Frasier, D.G. Westfall and D. Inman. 2004. Economic feasibility of variable-
rate nitrogen application utilizing site-specific management zones. Agron. J. 96:1572-1580.
North Dakota State Seed Department. 2008. Identity Preserved Program. (accessed April 2018).
Schimmelpfennig, D. 2016. Farm profits and adoption of precision agriculture. USDA-ERS Report Number 217. Washington, D.C. (Accessed April 2018).
Shockley, J.M., C.R. Dillon and S.A. Shearer. 2008. Cost savings for multiple inputs with swath control and auto-guidance technologies. Proceedings of the 9th International Conference on Precision Agriculture. July 20-23, Denver, Colo.
Swenson, A., and R. Haugen. Projected 2009 crop budgets south valley North Dakota. NDSU Farm Management Planning Guide, December 2008. North Dakota State University Extension, Fargo, N.D.

Revised May 2018

