Oakes
Carrington
P.O. Box
531,
E-mail: Blaine.Schatz@ndsu.edu
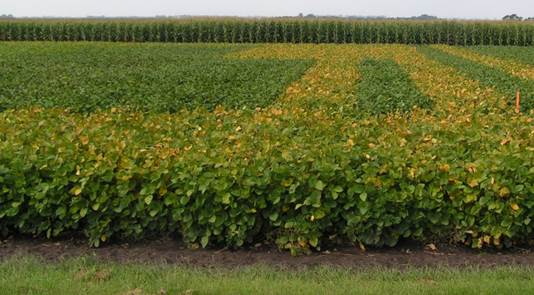
Evaluation of
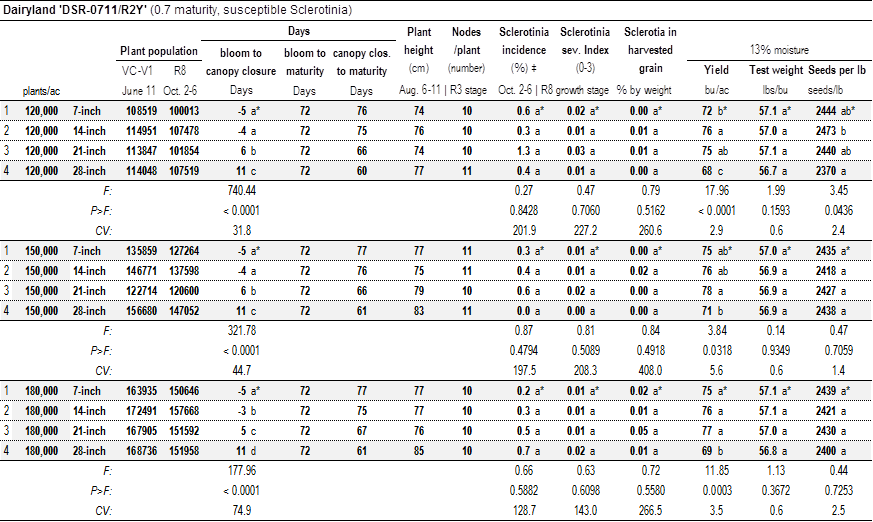
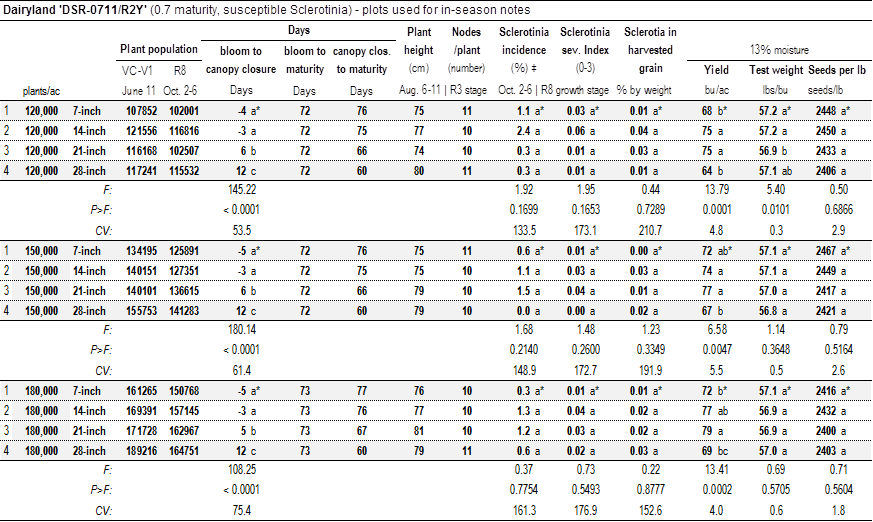
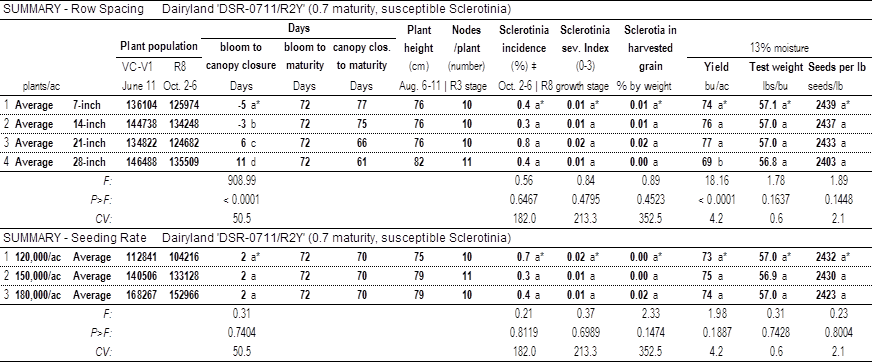
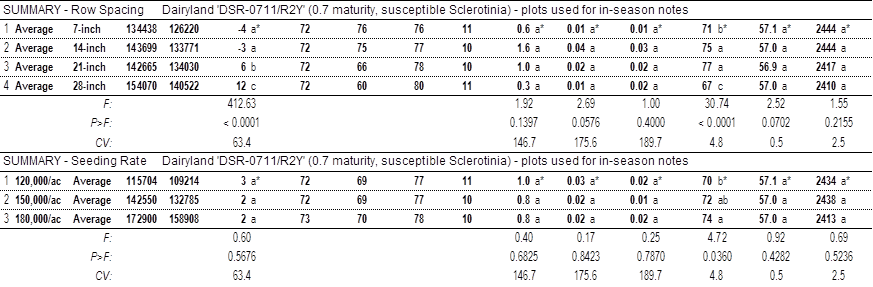
Plant Populations and Row Spacing for Management of Sclerotinia in Soybeans
M. Wunsch, M. Schaefer, B. Kraft and S. Kallis, L. Besemann,
H. Eslinger
METHODS
General Agronomics: The study was on a Maddock sandy loam soil type. The
previous crop was onion on replicate one and soybean on replicates two to
six. The tillage operation consisted of
disking once with a Wishek disk (April 14) followed by three passes with a
multiweeder; once (April 29) to level the seedbed and twice to incorporate the
herbicide (May 19). The maintenance herbicide applications were Trust
(4 lbs/gal trifluralin; Winfield Solutions) applied at 1 pt/acre preplant
incorporated (May 19) Roundup Power Max 30 oz/acre (June 17), and Roundup Power
Max 20 oz/acre (June 30).
Experimental design:
A completely randomized split-split block design with six replicates.
Main factor = variety, sub-factor =
seeding rate (132,000; 165,000; or 198,000 pure live seeds per acre),
sub-sub-factor = row spacing (7, 14, 21, or 28 inches). The row spacing
treatments – 28 inches (two rows per plot), 21 inches (three rows per plot), 14
inches (four rows per plot), and 7 inches (seven rows per plot. The seeded plot
size was 5 feet (center to center) by 20 feet long. The harvested plot size was
5 feet (center to center) and approximately 17 feet long.
To maintain a constant distance between the outermost rows of adjacent
plots, a filler plot with 14-inch row spacing was established on both sides of
each of the 2-row plots seeded to 28-inch row spacing. For plots with 7-, 14-,
and 21-inch row spacing, the distance between the outermost rows of adjacent
plots was 18 inches. For plots with 28-inch row spacing, the distance between
the outermost row of the adjacent (filler) plots and the soybeans was 25
inches.
Planting details: The study was planted on May 21, 2015.
Seed treatments used were Apron Maxx RTA (5.0 fl oz/100 lbs seed) +
Imidacloprid 4ST (3 fl oz/100 lbs seed). Imidacloprid
4ST (Willowood) contains 4 lbs/gal thiamethoxam; Apron Maxx
RTA (Syngenta) contains 0.096 lb/gal mefenoxam and 0.064 lb/gal fludioxonil.
Cell‑Tech granular inoculum for soybean (minimum 100 million Bradyrhizobium japonicum viable
cells/gr; Novozymes, Saskatoon, SK) was applied in-furrow 17.2 lb/acre.
Plant establishment: Soybean establishment was assessed June 11 when
the soybeans were at the VC to V1 growth stage (predominant V1) by counting all
plants along the full length of the plot in rows 2, 3, 5, and 6 of each 7-row
plot (7-in. row spacing), rows 2 and 3 of each 4-row plot (14-in. row spacing),
row 2 of each 3-row plot (21-in. row spacing), and the northern row of each
2-row plot (28-in. row spacing).
Bloom initiation: Bloom initiation, defined as 80 to 90% of plants
at the R1 growth stage, was assessed every 2 to 3 days from the appearance of
blossom until all varieties had reached 80-90% R1 by evaluating 10 immediately
adjacent plants in each plot.
Canopy closure and height: The date that the ground could no longer be seen
between rows within a plot was recorded for every plot by evaluating plots
every 2 to 3 days as the canopy began to close in the bushiest variety until
the canopy closed. Height of the canopy was assessed in one location per plot
when the soybeans in that plot reached the R3 growth stage.
Number of nodes: The number of nodes per plant was assessed on one
plant per plot when the soybeans in that plot reached the R3 growth stage.
End-of-season plant
population: Population was assessed
concurrently with disease assessments on October 2-6 at the R8 growth stage by
counting all plants along the full length of the plot in rows 2, 3, 5, and 6 of
each 7-row plot (7-in. row spacing), rows 2 and 3 of each 4-row plot (14-in.
row spacing), row 2 of each 3-row plot (21-in. row spacing), and the northern
row of each 2-row plot (28-in. row spacing).
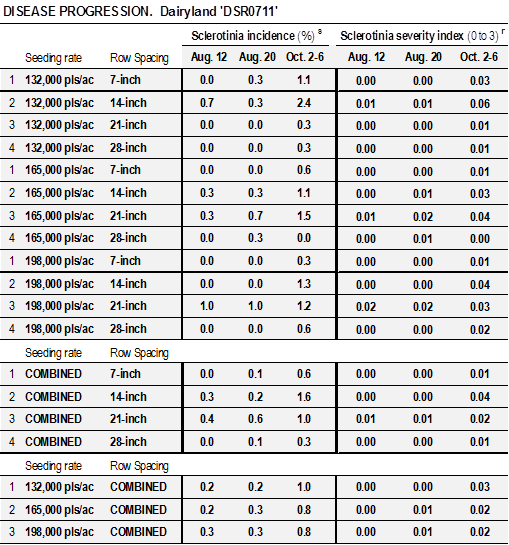
Disease assessments -
in-season: Sclerotinia incidence
and severity were assessed August 12 and August 20 on 50 plants per plot
using the 0 to 3 scale developed by Craig Grau (Grau and Radke 1984; Plant
Disease 68: 56-58): 0 = no symptoms, 1 = lesions on lateral branches only, 2 =
lesions on main stem, no wilt, and normal pod development, 3 = lesions on main
stem resulting in wilting, poor pod fill, and plant death. The first 50 plants
(from the east) along the southern row of each 2-row plot (28-inch row spacing),
along the middle row of each 3-row plot (21-inch row spacing), along the second
row from the south of each 4-row plot (14-inch row spacing), and along the
second and third rows from the south of each 7-row plot (7-inch row spacing)
were evaluated. If there were insufficient plants in the designated rows, the
remainder of the 50 plants were evaluated in the next row to the north within
the plot starting at the west end of the additional row.
Disease assessments - end
of season: Sclerotinia incidence
and severity were assessed October 2-6 at the R8 growth stage using the 0 to 3
scale developed by Craig Grau (Grau and Radke 1984; Plant Disease 68:
56-58): 0 = no symptoms, 1 = lesions on
lateral branches only, 2 = lesions on main stem, no wilt, and normal pod development,
3 = lesions on main stem resulting in wilting, poor pod fill, and plant
death. All plants were assessed along
the full length of the plot in rows 2, 3, 5, and 6 of each 7-row plot (7-in.
row spacing), rows 2 and 3 of each 4-row plot (14-in. row spacing), row 2 of
each 3-row plot (21-in. row spacing) and the northern row of each 2-row plot
(28-in. row spacing). An average of 117
plants and minimum of 46 plants were assessed in each plot.
Disease establishment and
irrigation: The trial was established
on a site with a previous history of Sclerotinia epidemics. To sustain the soil
moisture necessary for apothecia development, the trial was irrigated
aggressively to create conditions favorable for apothecia production and
Sclerotinia infection.
Harvest, seed yield and
quality assessment: The soybeans were
harvested October 7. Yields were calculated on the basis of a 5-ft plot width
and the measured plot length. The seed moisture was assessed after the grain
was cleaned. The seed yield and quality results were adjusted from the actual
grain moisture to a standard 13% moisture level. The percent of sclerotia by
weight in the harvested grain was assessed by manually removing all sclerotia
from a 200-gram subsample of grain from each plot.
Commentary: Sclerotinia disease development was low in this
trial due to high temperatures and low relative humidity experienced in July
and August.
Management of Sclerotinia in Soybeans
We appreciate partial financial support for
this project form the North Dakota Soybean Council.

![]()
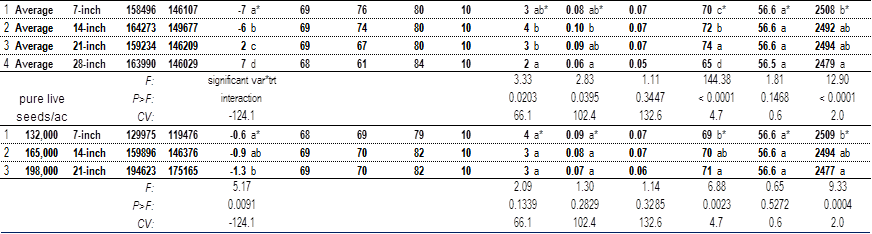
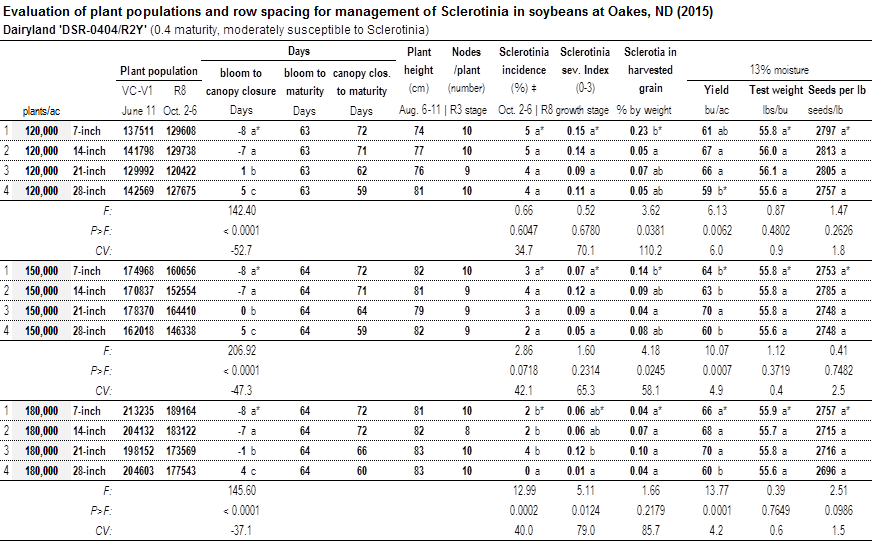
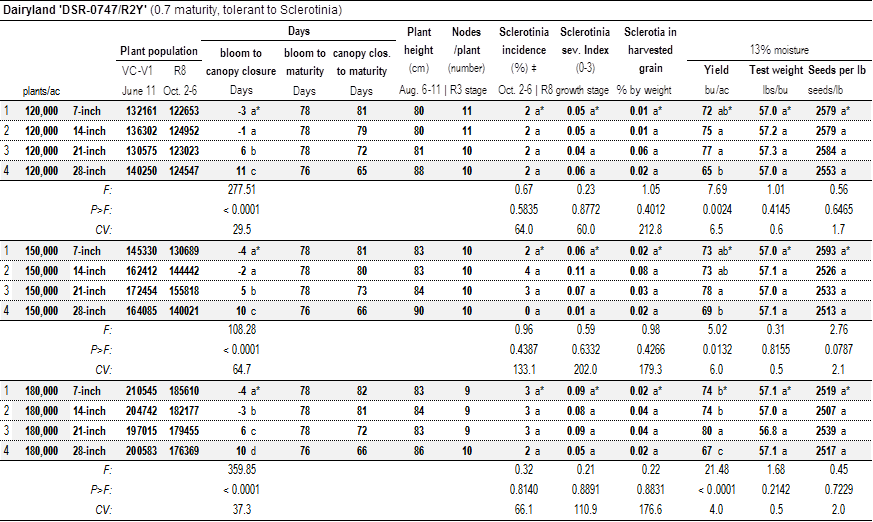
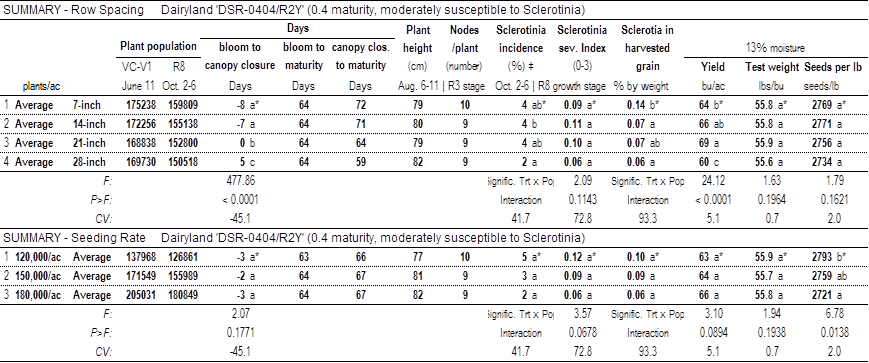
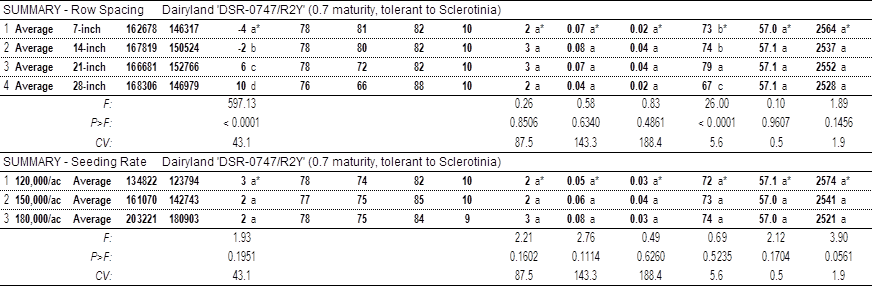
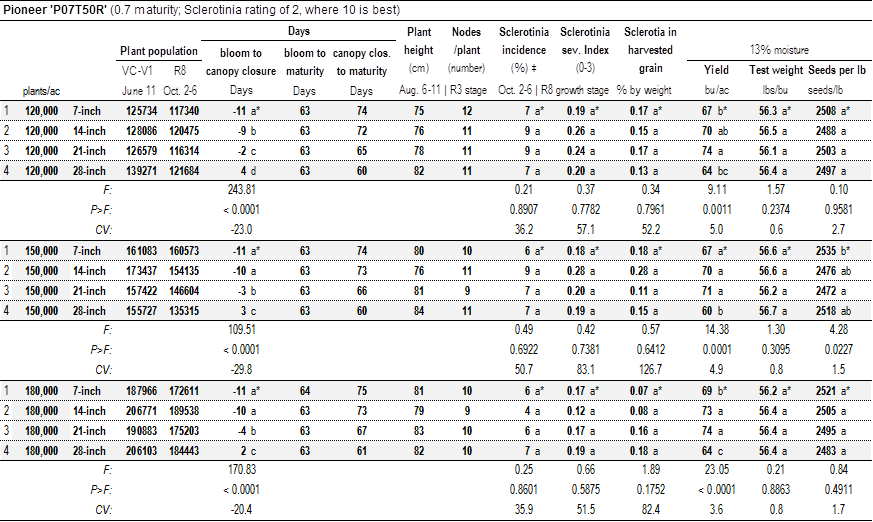
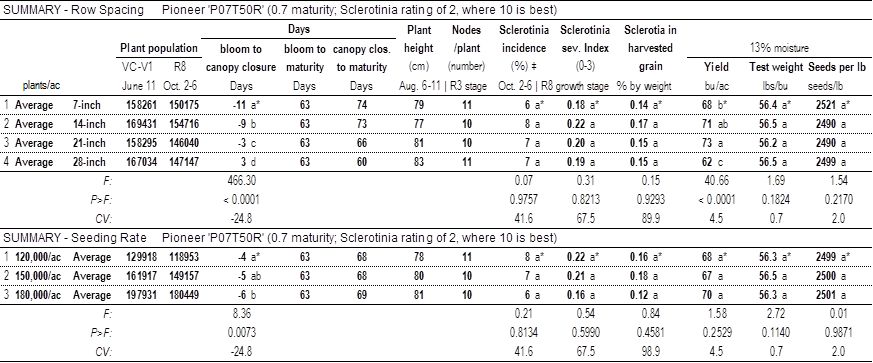
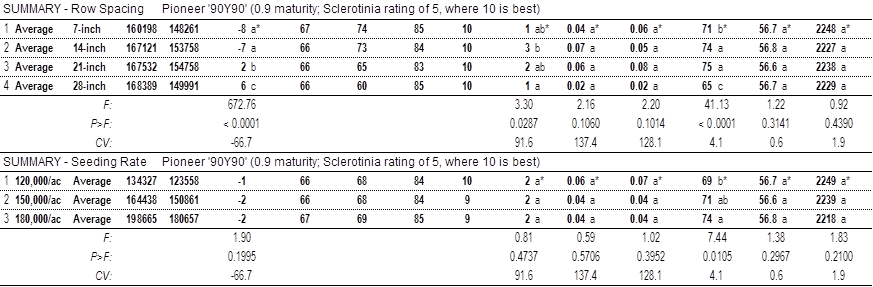
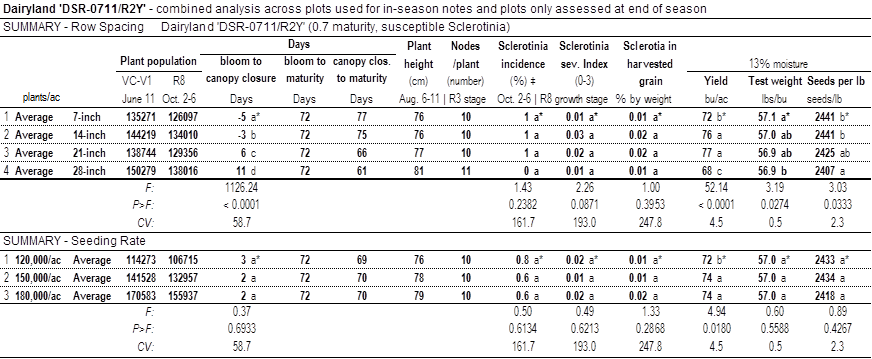
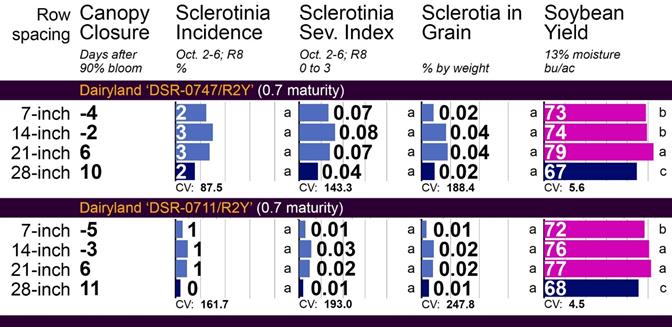
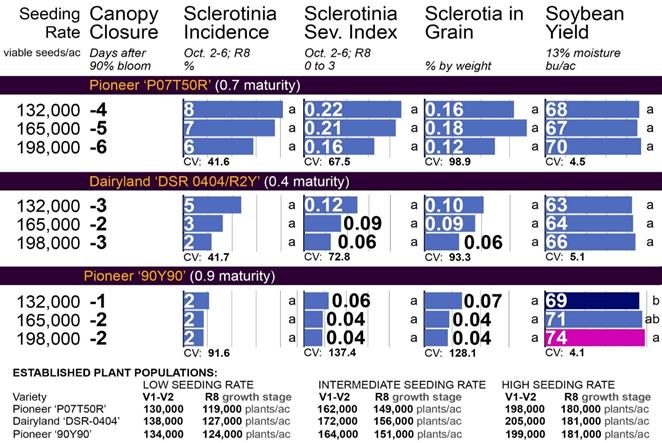
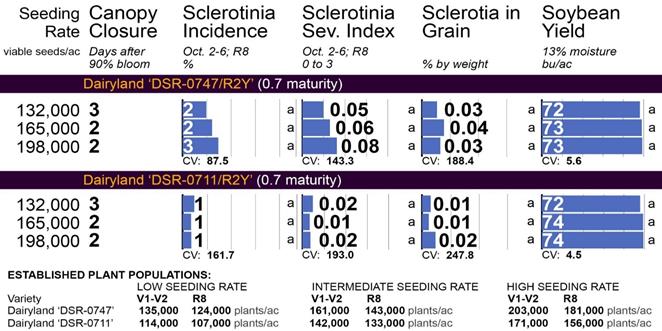
z Plant population:
Soybean establishment was assessed June 11 when soybeans were at the VC to V1
growth stage and end-of-season soybean populations were assessed Oct. 2-6 at
the R8 growth stage by counting all plants along the full length of the plot in
rows 2, 3, 5, and 6 of each 7 row plot (7-in. row spacing), rows 2 and 3 of
each 4-row plot (14-in. row spacing), row 2 of each 3-row plot (21-in. row
spacing) and the northern row of each 2-row plot (28-in. row spacing).
y Days from bloom to canopy closure: Number of days between bloom initiation (80-90% of
the plants with an open blossom) and canopy closure (canopy fully covered
ground between the rows).
x Days from bloom to maturity: Number of days between bloom initiation (80-90% of
the plants with an open blossom) and maturity (R8 growth stage; at least 95% of
the pods reached their full color).
w Days from canopy closure to maturity: Number of days between canopy closure (canopy
fully covered ground between rows) and maturity (R8 growth stage; at least 95%
of the pods reached their full color).
v Canopy height:
Height of the canopy at the R3 growth stage; assessed at two locations per
plot.
u Number of nodes:
Number of nodes per plant at the R3 growth stage; within each plot, 10 plants
were assessed (five plants at each of two locations per plot).
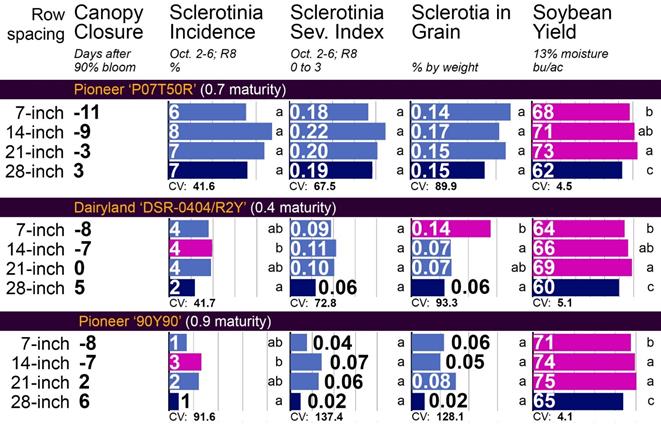
s Sclerotinia stem rot incidence: Assessed Oct. 2-6 at the R8 growth stage by
evaluating all plants in the middle 3 rows of plots seeded to 7-inch rows,
middle 2 rows of plots seeded to 14-inch rows, middle row of plots seeded to
21-inch rows, and first row of plots seeded to 28-inch rows.
r Sclerotinia severity: Average disease severity among plants expressing
Sclerotinia stem rot on Oct. 2-6 at the R8 growth stage. A 1 to 3 scale was employed: 1 = lesions on
lateral branches only, 2 = lesions on main stem, no wilt, and normal pod
development, 3 = lesions on main stem resulting in wilting, poor pod fill, and
plant death. Assessed by evaluating all plants in the middle 3 rows of plots
seeded to 7-inch rows, middle 2 rows of plots seeded to 14-inch rows, middle
row of plots seeded to 21-inch rows, and first row of plots seeded to 28-inch
rows.
q Sclerotinia disease severity index: Average disease severity across all plants,
including those without any disease, on Oct. 2-6 at the R8 growth stage. A 0 to 3 scale was employed: 0 = no symptoms, 1 = lesions on lateral
branches only, 2 = lesions on main stem, no wilt, and normal pod development, 3
= lesions on main stem resulting in wilting, poor pod fill, and plant
death. Assessed by evaluating all
plants in the middle 3 rows of plots seeded to 7-inch rows, middle 2 rows of
plots seeded to 14-inch rows, middle row of plots seeded to 21-inch rows, and
first row of plots seeded to 28-inch rows.
p Sclerotia in harvested grain: Assessed by manually removing all sclerotia from a
200-gram subsample of grain from each plot.
‡ To meet model
assumptions of normality and homoskedasticity, analysis of variance was
conducted on data subjected to a systematic natural-log transformation [LN(x+1)
for data sets that included values < 1.0, LN(x) for data sets with all
values ≥ 1.0].
* Within-column means followed by different letters
are significantly different (P < 0.05; Tukey
multiple comparison procedure).

![]()

![]()
Oakes
Irrigation Research Site