Oakes Irrigation
Research Site
Carrington Research Extension Center * North
Dakota State University
P.O. Box 531, Oakes,
ND 58474-0531, Phone: (701) 742-2744, FAX: (701) 742-2700,
E-mail: Blaine.Schatz@ndsu.edu Leonard.Besemann@ndsu.edu
Field Evaluation of Sunflower Hybrids and Breeding
Lines for Susceptibility to Sclerotinia Head Rot Oakes, ND (2014)
Leonard Besemann and Michael Wunsch
Methods
General
agronomics: The study was on a Hecla sandy loam/Maddock sandy loam soil type. The
soil fertility results from the fall soil test:
pH = 6.8; 2.0% organic matter; soil N 21 lbs/acre; soil P = 20 ppm, soil
K = 181 ppm, soil and S 32 lb/acre.
The previous crop was field corn and the tillage operation consisted of
disking twice followed by two passes with a multiweeder to smooth the seedbed
and incorporate the herbicide.
Experimental design: A completely randomized block
design with four replicates. The seeded
plot size was 2.5 feet (center to center) by 20 feet long. There was one row per plot and the row
spacing was 30 inches. Guard plots (10
feet wide) were established along all perimeters of the trial.
Planting
details: The sunflowers were planted on May 29 using a
cone seeder. The seeding rate was 3.83
seeds/linear foot of row = 60,000 seeds /acre (when sufficient seed was
available). The final plant population
was 1 plant every 10 inches of row = 21,000 plants/acre. The final population was established by
manual thinning the sunflowers at the V2 to V4 growth stage (two to four true
leaves).
Disease
establishment: Inoculations were conducted over multiple
days such that every head was inoculated twice - once at approximately R5.4 to
R5.6 (40 to 60% of the disk flowers blooming or already bloomed) and once at approximately
R5.5 to R5.9 (50 to 90% of the disk flowers blooming or already bloomed). To ensure that every plant was inoculated
twice, plants were given a dot of spray paint on an upper leaf at each
inoculation; once a plant received two dots of spray paint, the plant received
no additional inoculations.
Spore solutions were prepared by
adding laboratory-grown ascospores of Sclerotinia sclerotiorum to
non-chlorinated water and adding one to two drops of Tween 20. Hand-held spray bottles were calibrated to
determine how much liquid was released through each squirt of the bottle, and
the spore solution was adjusted so that 5,000 spores were delivered through 3
squirts of the spray bottle. At each
inoculation, 5,000 spores were applied to the front of each head (each head
received a total of 10,000 spores over two inoculations).
Supplemental overhead irrigation was
applied to this trial through a micro-sprinkler misting system, with the
frequency and intensity of irrigation adjusted relative to weather conditions.
Agronomic
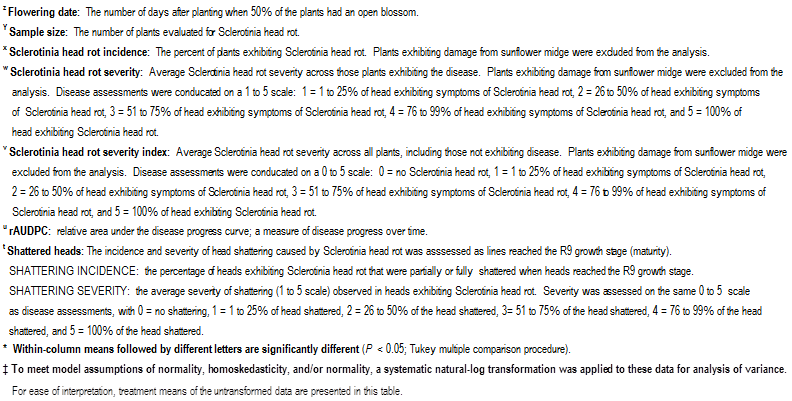
notes: The flowering date for each plot was the date
that 50% of the plants entered bloom.
Disease
notes: Within each plot, disease assessments were
conducted three times: at the R7 growth
stage (back of the head has started to turn a pale yellow color), at the R8
growth stage (back of the head is yellow but the bracts remain green), and at
the R9 growth stage (bracts yellow and brown, and heads ready for harvest;
physiological maturity). Plants
exhibiting damage from sunflower midge were excluded from the analysis;
otherwise, all plants in each row were evaluated. A 0 to 5 scale was utilized: 0 = no Sclerotinia head rot, 1 = 1 to 25% of
head exhibiting symptoms of Sclerotinia head rot, 2 = 26 to 50% of head
exhibiting symptoms of Sclerotinia head rot, 3 = 51 to 75% of head exhibiting
symptoms of Sclerotinia head rot, 4 = 76 to 99% of head exhibiting symptoms of
Sclerotinia head rot, and 5 = 100% of head exhibiting Sclerotinia head
rot. Disease assessments were taken as
plots reached the target growth stage; R7 assessments were taken August 25 to
September 19, R8 assessments were taken September 5 to 30, and R9 assessments
were taken September 10 to October 6.
rAUDPC:
The progression of disease over time relative to maximum disease; a
rating of 100 equals 100% of plants with heads fully diseased with Sclerotinia
head rot from bloom initiation until the R9 growth stage, and a rating of 0
equals 0% of plants showing symptoms of Sclerotinia head rot over the same
interval. Calculated with the following
formula:
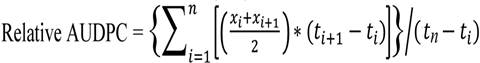
where xi =
disease severity index at the ith observation, ti = time in days at the ith
observation, and n = number of observations.
Shattered
heads: The incidence and severity of head shattering
caused by Sclerotinia head rot was assessed on September 10 to October 6 as
plots reached the R9 growth stage (bracts yellow and brown, and heads ready to
harvest; physiological maturity).
Severity was assessed on a 0 to 5 scale, with 0 = no shattering, 1 = 1
to 25% of head shattered, 2 = 26 to 50% of the head shattered, 3 = 51 to 75% of
the head shattered, 4 = 76 to 99% of the head shattered, and 5 = 100% of the
head shattered. Results were reported as
shattering incidence and severity, where SHATTERING INCIDENCE denotes the percentage of heads exhibiting
Sclerotinia head rot that were partially or fully shattered when heads reached
the R9 growth stage and SHATTERING SEVERITY denotes the average severity of shattering (1 to 5
scale) observed in heads exhibiting Sclerotinia head rot.
This trial was not harvested.
Statistical analysis: Data were evaluated with analysis of
variance. Assumptions of ANOVA: (1) The
assumption of constant variance was assessed with Levene's test for homogeneity
of variances and visually confirmed by plotting residuals against predicted
values. (2) The assumption of normality
was assessed with the Shapiro-Wilk test and visually confirmed with a normal
probability plot. (3) The assumption of
additivity of main-factor effects across replicates (no replicate-by-treatment
interaction) was evaluated with Tukey's test for nonadditivity. To meet model assumptions, a systematic
natural-log transformation was applied to the R7 Sclerotinia head rot incidence
data; the R7, R8, and R9 disease severity index data; and the relative
area-under-the-disease-progress-curve data.
Analysis of variance was conducted on the transformed data. The shattering data exhibited moderate
deviations from model assumptions, but a systematic transformation could not be
found that addressed the problem, and the untransformed data were analyzed. All other data met model assumptions. Assessment of treatment differences: Analyses were conducted with replicate and
treatment as main factor effects.
Single-degree-of-freedom contrasts were performed for all pairwise
comparisons of isolates; to control the Type I error rate at the level of the
experiment, the Tukey multiple comparison procedure was employed. Analyses were implemented in PROC UNIVARIATE
and PROC GLM of SAS (version 9.3; SAS Institute, Cary, NC).
FUNDED
BY THE USDA NATIONAL SCLEROTINIA INITIATIVE AND SYNGENTA, NUSEED, NUSEED
GLOBAL, GENOSYS, MYCOGEN, AND RED RIVER COMMODITIES.
Oakes Irrigation Research Site
Variety trials
Crop index Home page Report 2014

This
material is based upon work supported by the National Institute of Food and
Agriculture, U.S. Department of Agriculture, under agreement No.
58-5442-4-018. Any opinions, findings, conclusions, or recommendations
expressed in this publication are those of the author(s) and do not necessarily
reflect the view of the U.S. Department of Agriculture.
Oakes
Irrigation Research Site
Variety trials
Crop index Home page Report 2014