Oakes Irrigation
Research Site
Carrington Research Extension Center * North
Dakota State University
P.O. Box 531, Oakes,
ND 58474-0531, Phone: (701) 742-2744, FAX: (701) 742-2700,
E-mail: Blaine.Schatz@ndsu.edu
Leonard.Besemann@ndsu.edu
Evaluation of
Partial Host Resistance and Row Spacing for Management of Sclerotinia on
Soybeans
Leonard
Besemann, Michael Schaefer, and Michael Wunsch
METHODS
General Agronomics:
The study was on a Hecla
sandy loam and Maddock sandy loam soil type. The soil fertility from the 2013
fall soil test was: pH = 7.1; 1.7%
organic matter; soil N 12 lbs/acre; soil P = 34 ppm,
soil K = 217 ppm, soil S 20 lb/acre and Zn =
3.60 ppm. The previous crop was spring
wheat and the tillage operation consisted of disking twice followed by two
passes with a multiweeder to smooth the seedbed and
incorporate the
herbicide. The Cell-Tech granular
inoculate was mixed with the seed and applied in-furrow with the seed at an
application rate of 0.1 grams per square foot.
The maintenance herbicide applications
were Trust (1 pt/acre) preplant
incorporated on May 22 and two applications of Roundup Power Max (20 oz/acre)
on June 20 and July 9.
Experimental design:
A completely randomized block with a split-plot arrangement with six
replicates; main factor = row spacing, sub-factor = variety. The seeded plot size was 5 feet (center to
center) by 20 feet
long.
The harvested plot size was 5 feet (center to center) and approximately
17 feet long. Untreated buffer plots
were established between treatment plots, and guard plots were established on
the edges of the trial.
Planting details:
The seeding rate was 165,000 pure live seeds/acre. Row spacing was 14 inches (with 4 rows per
plot) in the first experiment and 28 inches (with two rows per plot) in the
second experiment. The study
was planted on May 26, 2014. Seed treatment was Apron Maxx RTA (5.0 fl oz/100 lbs seed) + Cruiser (1.28 fl
oz/100 lbs seed).
Agronomic and disease assessments: Bloom initiation was assessed on the date
that 80-90% of the plants had an open blossom.
Within each plot, 20 plants (ten plants at each of two locations per
plot) were evaluated.
Canopy closure was assessed as the date that the soybean canopy fully
covered the ground between rows. Canopy
height was assessed at two locations per plot on July 24 or July 28 when the
soybeans were at the
R3 growth stage (pods 3/16 inch
long at one of the four uppermost nodes).
The number of nodes were assessed by counting the number of nodes per
plant on July 24 or July 28 when the soybeans were at the
R3 growth stage. Within each plot
six plants were assessed (three plants at each of two locations per plot). Lodging was assessed shortly before maturity
on September 16 as the percent of the canopy showing lodging.
Sclerotinia incidence and severity was assessed on September 11 at the R7
growth stage (at least one normal pod on the main stem had reached its mature
pod color) using the 0 to 3 scale developed by Craig Grau
(Grau
and Radke 1984;
Plant Disease 68: 56-58): 0 = no
symptoms, 1 = lesions on lateral branches only, 2 = lesions on main stem, no
wilt, and normal pod development, 3 = lesions on main stem resulting in
wilting, poor
pod fill, and plant death. In each plot, 90 plants were evaluated (30
plants in each of three locations per plot).
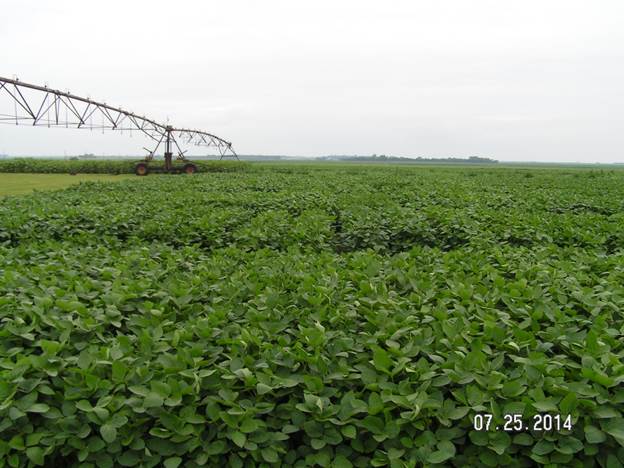
Disease establishment and irrigation: The trial was established on a site with a
previous history of Sclerotinia epidemics.
To promote apothecia development and disease establishment,
supplementary overhead
irrigation was applied to
this trial through a linear irrigator.
Harvest and seed yield and quality assessment: The trial was harvested on
October 9. To facilitate accurate yield
assessment, plot lengths were measured shortly before harvest. Yields were calculated on the basis of
a 5-ft plot width and the measured plot
length. Seed moisture was assessed after
the grain was cleaned. Seed yield and
quality results were adjusted from the grain actual moisture to a standard 13%
moisture level.
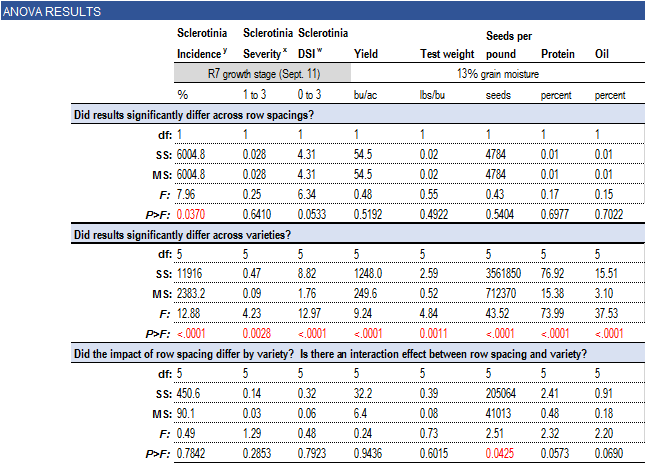
Statistical analysis: Data were evaluated with analysis of
variance. Assumptions of ANOVA: (1) The assumption of constant
variance was assessed with Levene's test for homogeneity
of variances and visually confirmed
by plotting residuals against predicted values. (2) The assumption of normality was assessed
with the Shapiro-Wilk test and visually confirmed with a normal probability
plot. (3) The assumption of additivity
of main-
factor effects across replicates (no
replicate-by-treatment interaction) was evaluated with Tukey's test for nonadditivity. All data met model assumptions except the
Sclerotinia incidence and disease severity index data in
soybeans planted to wide (28-inch) rows. For data that violated model assumptions, a
systematic natural-log transformation [LN(x+1) for data sets with values less
than 1, otherwise LN(x)] corrected the distributional
problems and was applied.
For soybeans planted to narrow rows, the number of days before or after
bloom that the canopy closed: To
facilitate proper calculation of the coefficient of variation in this data set,
analysis of
variance was conducted on data transformed by addition of an
integer that made all data points equal to or greater than zero; the
transformation did not affect F-test results or pair-wise treatment
comparisons. Assessment
of the effects of irrigation intensity on disease and
agronomic outcomes: Analyses
were conducted with replicate, main factor, main factor by replicate
interaction, sub-factor, and sub-factor by main-factor interaction in
the model, with F-tests for replicate and the main
factor (row spacing) utilizing replicate-by-row spacing interaction for the
error term. Assessment of the effects of variety on disease and agronomic outcomes:
Analyses
were conducted with replicate and treatment as main
factor effects. Single-degree-of-freedom
contrasts were performed for all pairwise comparisons of isolates; to control
the Type I error rate at the level of the experiment,
the Tukey multiple comparison procedure was
employed. Analyses were implemented in
PROC UNIVARIATE and PROC GLM of SAS (version 9.3; SAS Institute, Cary, NC).
Results and Discussion
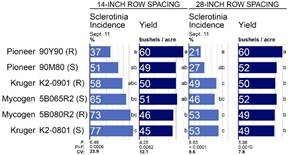
Performance
of six varieties under high Sclerotinia disease pressure
z Varieties differed in their Sclerotinia
stem rot resistance ratings:
"R" denotes reduced susceptibility to Sclerotinia stem rot;
"S" denotes heightened
susceptibility to Sclerotinia stem rot.
On a 0 to 9 scale (where 9 is good), Mycogen
assigned '5B080R2' a white mold resistance rating of 8 and '5B065R2' a white
mold resistance rating of 6.
On a 0 to 10 scale (where 10 is excellent), Kruger
assigned 'K2-0901 a white mold resistance rating of 6 and 'K2-0801' a white
mold resistance rating of 4.
On a 1 to 9 scale (where 9 is best), Pioneer
assigned '90Y90' a white mold resistance rating of 6 and '90M80' a white mold
resistance rating of 3.
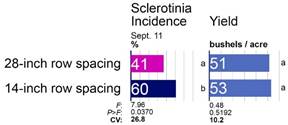
y Sclerotinia stem rot incidence was
assessed by evaluating 90 plants in each plot (30 plants in each of three
locations per plot).
Assessed on Sept. 11 at the R7
growth stage.
x Sclerotinia severity: Average disease severity among plants
expressing Sclerotinia stem rot. A 1 to
3 scale was employed:
1 = lesions on lateral branches
only, 2 = lesions on main stem, no wilt, and normal pod development, 3 =
lesions on main stem
resulting
in wilting, poor pod fill, and plant death.
In each plot, 90 plants in each plot (30 plants in each of three
locations per
plot). Assessed on Sept. 11 at the R7 growth stage.
w Sclerotinia
disease severity index: Average
disease severity across all plants, including those without any disease. A 0 to 3
scale was
employed: 0 = no symptoms, 1 = lesions
on lateral branches only, 2 = lesions on main stem, no wilt, and normal pod
development,
3 = lesions on main stem resulting in wilting, poor pod fill, and plant
death. In each plot, 90 plants in each plot
(30 plants in each of
three locations per plot). Assessed on
Sept. 11 at the R7 growth stage.
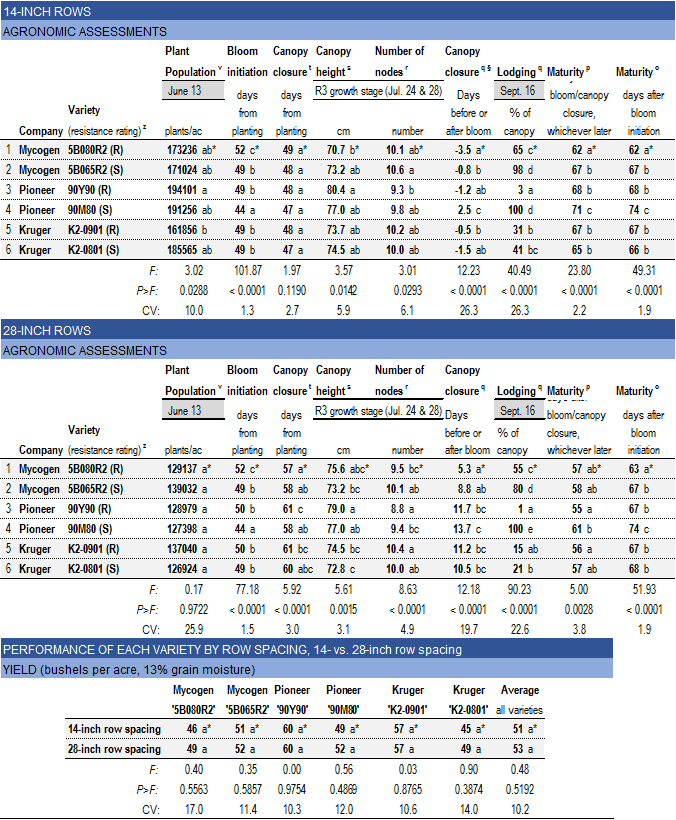
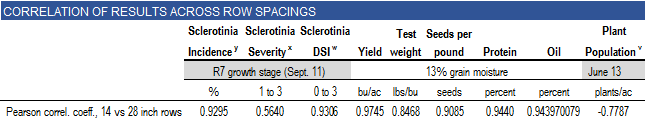
v Plant population: Plants per acre; assessed at the V1 growth
stage by counting the number of plants along 6 meters of row.
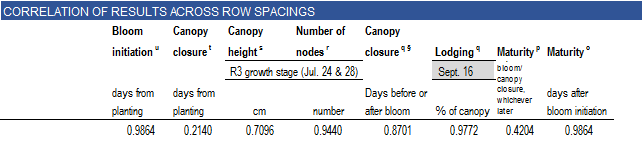
u Bloom initiation: Number of days after planting that 80-90% of
the plants had an open blossom.
t Canopy
closure: Days after planting that the
canopy fully covered the ground between rows.
s Canopy
height: Height of the canopy at the R3
growth stage; assessed at two locations per plot.
r Number
of nodes: Number of nodes per plant at the
R3 growth stage within each plot, six plants were assessed (three plants at
each of
two locations per plot).
q Lodging:
Percent of the canopy exhibiting lodging on Sept. 16 shortly before
maturity.
p
Physiological maturity: Number of
days after bloom/canopy closure when plants reached maturity (R8 growth stage),
where
maturity
is defined as 95-100% of the pods brown and senesced.
o
Physiological maturity: Number of
days after bloom/canopy closure when plants reached maturity (R8 growth stage),
where
maturity
is defined as 95-100% of the pods brown and senesced.
*
Within-column means followed by different letters are significantly different (P < 0.05; Tukey
multiple comparison procedure).
‡ To meet model assumption of homoskedasticity,
analysis of variance was conducted on data subjected to a systematic
natural-log
transformation. For ease of interpretation, treatment means
of the untransformed data are presented.
§ To facilitate proper calculation of the coefficient of variation,
analysis of variance was conducted on data transformed by addition
of an
integer that made all data points equal to or greater than zero. The transformation did not affect F-test
results or pair-wise
treatment
comparisons. Treatment means of the
untransformed data are presented.