Oakes Irrigation
Research Site
Carrington Research Extension Center * North
Dakota State University
P.O. Box 531, Oakes,
ND 58474-0531, Phone: (701) 742-2744, FAX: (701) 742-2700,
E-mail: Blaine.Schatz@ndsu.edu
Optimizing
Fungicide Application Timing for Sclerotinia Control in Soybeans
Leonard
Besemann, Michael Schaefer, and Michael Wunsch
METHODS
General agronomics:
The study was on an Embden
sandy loam soil type. The soil fertility from the fall soil test: pH = 6.9; 2.0% organic matter; soil N 44
lbs/acre; soil P = 32 ppm, soil K = 208 ppm, soil S 18 lb/acre and Zn = 4.48
ppm. The previous crop was pinto bean
and the tillage operation consisted of disking twice followed by two passes
with a multiweeder to smooth the seedbed and
incorporate the herbicide. Rhizo-Flo granular inoculant for soybeans (Bradyrhizobium japonicum;
Becker Underwood / BASF Corp.) was mixed with the seed immediately before
planting and applied in-furrow with the seed at 170 grams per 1000 feet of
row. The maintenance herbicide
applications were Trust (1 pt/acre) preplant
incorporated on May 22 and two applications of Roundup Power Max (20 oz/acre)
on June 20 and July 9.
Experimental design:
A completely randomized block design with six replicates. The seeded plot size was 5 feet (center to
center) by 20 feet long. The harvested
plot size was 5 feet (center to center) and approximately 17 feet long. Untreated buffer plots were established
between treatment plots, and guard plots were established on the edges of the
trial.
Planting details:
Mycogen ‘5B005R2’ was seeded at the rate of 165,000 pure live
seeds/acre. Row spacing was 14 inches
(with 4 rows per plot) and 28 inches (with two rows per plot). The study was planted on May 26, 2014. Seed treatments used were Apron Maxx RTA (5.0
fl oz/100 lbs seed) + Cruiser (1.28 fl oz/100 lbs seed).
Fungicide applications: At the R1 growth stage, fungicides were
applied July 16 at 3:37-3:45 PM when 80-90% of plants had an open blossom; wind
= ESE @ 3 MPH; RH 45%; 78° F; Canopy closure:
Fourteen inch = 100%; 28 inch = 60%.
At the R2 growth stage fungicides were applied July 21 at 10:37‑10:48
AM; approximately 90% of plants had an open blossom at one of the two nodes
(90% at R2); wind = E @ 6 MPH; RH 79%; 86° F; Canopy closure: 14 inch = 100%; 28 inch = 90%. In 30-inch rows, 90% canopy closure:
fungicides were applied concurrently with the R2 application timing on
July 21 from 10:50-10:53 AM approximately 90% of the plants were at R2 growth
stage (open blossom at one of the top two node); wind = E @ 7 MPH; RH 79%; 86°
F. In 30-inch row, 95% canopy
closure: Fungicides were applied July 22
from 1:22-1:24 PM; R2 growth stage; wind = N @ 7 MPH; RH 79%; 77° F.
In 30-inch row,
100% canopy closure: fungicides were
applied July 25 from 11:22-11:25 AM at the late R2 to early R3 growth stage;
wind = N @ 9 MPH; RH 93%; 67° F.
Notes and disease establishment:
The trial was established on a site with a previous history of
Sclerotinia epidemics. To promote
apothecia development and disease establishment, supplementary overhead irrigation
was applied to this trial via a linear irrigator. Sclerotinia incidence and severity were
assessed on Sept. 11 at the R7 growth stage using the 0 to 3 scale developed by
Craig Grau (Grau and Radke 1984; Plant Disease 68: 56-58): 0 = no symptoms, 1 = lesions on lateral
branches only, 2 = lesions on main stem, no wilt, and normal pod development, 3
= lesions on main stem resulting in wilting, poor pod fill, and plant
death. In each plot, 90 plants were
evaluated (30 plants in each of three locations per plot).
Harvest, seed yield and quality assessment: The trial was harvested on
October 9. To facilitate accurate yield
assessment, plot lengths were measured shortly before harvest. Yields were calculated on the basis of a 5-ft
plot width and the measured plot length.
Seed moisture was assessed after the grain was cleaned. Seed yield and quality results were adjusted
from the grain actual moisture to a standard 13% moisture level.
Statistical
analysis: Data were evaluated with analysis of
variance. Assumptions of ANOVA: (1) The
assumption of constant variance was assessed with Levene's
test for homogeneity of variances and visually confirmed by plotting residuals
against predicted values. (2) The
assumption of normality was assessed with the Shapiro-Wilk test and visually
confirmed with a normal probability plot.
(3) The assumption of additivity of main-factor effects across
replicates (no replicate-by-treatment interaction) was evaluated with Tukey's
test for nonadditivity. All data met model
assumptions. Assessment of fungicide
treatment effects: Analyses were
conducted with replicate and treatment as main factor effects. Single-degree-of-freedom contrasts were
performed for all pairwise comparisons of isolates; to control the Type I error
rate at the level of the experiment, the Tukey multiple comparison procedure
was employed. Analyses were implemented
in PROC UNIVARIATE and PROC GLM of SAS (version 9.3; SAS Institute, Cary, NC).
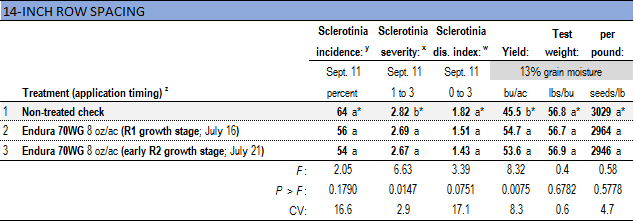
z
Fungicide application timing:
R1 growth stage: fungicides
were applied July 16 at 3:37-3:45 PM when 80-90% of plants had an open blossom
and 100% of the ground was covered by the canopy (closed
canopy); wind = ESE @ 3 MPH; RH 45%; air temperature = 78° F
Early R2 growth
stage: fungicides were applied July 21 at
10:37-10:48 AM; approximately 90% of plants had an open blossom at one of the
top two nodes (90% at R2) and the canopy was closed (100% canopy closure);
wind = E @ 6 MPH; RH 79%; air temperature = 86° F
y
Sclerotinia stem rot incidence: assessed by evaluating 90 plants
in each plot (30 plants in each of three locations per plot).
Evaluated on September 11 at the
R7 growth stage (at least one pod on the main stem had reached its mature pod
color).
x
Sclerotinia severity: Average disease severity among plants
expressing Sclerotinia stem rot. A 1 to
3 scale was employed:
1 = lesions on lateral branches only, 2 =
lesions on main stem, no wilt, and normal pod development, 3 = lesions on main
stem resulting in
wilting, poor pod fill, and plant death.
Evaluated on September 11 at the R7 growth stage (at least one
pod on
the main stem had reached its mature pod color).
w
Sclerotinia disease severity index: Average disease severity across
all plants, including those without any disease.
A 0 to 3 scale was employed: 0 = no symptoms, 1 = lesions on lateral
branches only, 2 = lesions on main stem, no wilt,
and normal pod
development, 3 = lesions on main stem resulting in wilting, poor pod fill, and
plant death. In each plot, 90
plants were
evaluated (30 plants in each of three locations per plot). Evaluated on September
11 at the R7 growth stage (at
least
one pod on the main stem had reached its mature pod color).
*
Within-column means followed by different letters are significantly different (P < 0.05; Tukey multiple comparison
procedure).
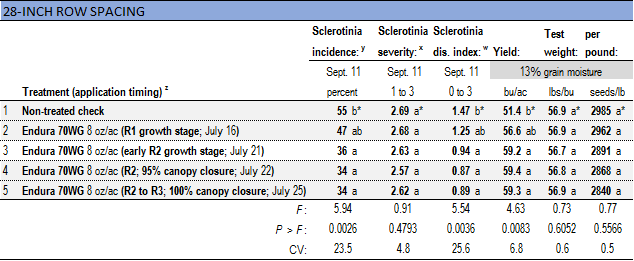
z
Fungicide application timing:
R1 growth stage: fungicides
were applied July 16 at 3:37-3:45 PM when 80-90% of plants had an open blossom
and 100% of the ground was covered by the canopy
(closed canopy); wind = ESE @ 3 MPH; RH 45%; air temperature = 78° F.
R2 growth stage: fungicides
were applied July 21 at 10:37-10:48 AM; approximately. 90% of plants had an
open blossom at one of the top two nodes (90% at R2) and 90% of the ground was
covered by canopy (90% canopy closure); wind = E @ 6 MPH; RH 79%; air
temperature = 86° F.
R2, 95% canopy closure: fungicides
were applied July 22 from 1:22-1:24 PM; R2 growth stage; wind = N @ 7 MPH; RH
65%; air temperature = 77° F.
R2 to R3, 100% canopy closure: fungicides
were applied July 25 from 11:22-11:25 AM at the late R2 to early R3 growth
stage; wind = N @ 9 MPH; RH 93%; air temperature = 67° F.
y
Sclerotinia stem rot incidence: assessed by evaluating 90 plants
in each plot (30 plants in each of three locations per plot).
Evaluated on September 11 at the
R7 growth stage (at least one pod on the main stem had reached its mature pod
color).
x
Sclerotinia severity: Average disease severity among plants
expressing Sclerotinia stem rot. A 1 to
3 scale was employed:
1 = lesions on lateral branches only, 2 =
lesions on main stem, no wilt, and normal pod development, 3 = lesions on
main stem resulting
in wilting, poor pod fill, and plant death.
Evaluated on September 11 at the R7 growth stage (at least
one pod
on the main stem had reached its mature pod color).
w
Sclerotinia disease severity index: Average disease severity across all
plants, including those without any disease.
A 0 to 3 scale was employed: 0 = no symptoms, 1 = lesions on lateral
branches only, 2 = lesions on main stem, no wilt,
and normal pod
development, 3 = lesions on main stem resulting in wilting, poor pod fill, and
plant death. In each plot, 90
plants were
evaluated (30 plants in each of three locations per plot). Evaluated on September
11 at the R7 growth stage (at
least
one pod on the main stem had reached its mature pod color).
*
Within-column means followed by different letters are significantly different (P < 0.05; Tukey multiple comparison
procedure).
Partial funding for this project was provided by the North Dakota Soybean
Council.
Oakes Irrigation Research Site
Variety trials
Crop index Home page Report 2014