Oakes Irrigation
Research Site
Carrington Research Extension Center * North Dakota State University
P.O.
Box 531, Oakes, ND 58474-0531, Phone: (701) 742-2744, FAX: (701) 742-2700,
E-mail: Walter.Albus@ndsu.edu
Onion Hybrid Performance Trial
Figure 1.
The effect of onion plant population on yield at the
Oakes Irrigation Research site in 2011.
Material and methods Table Report 2011 Home page
Corn Hybrid and Row Width Study
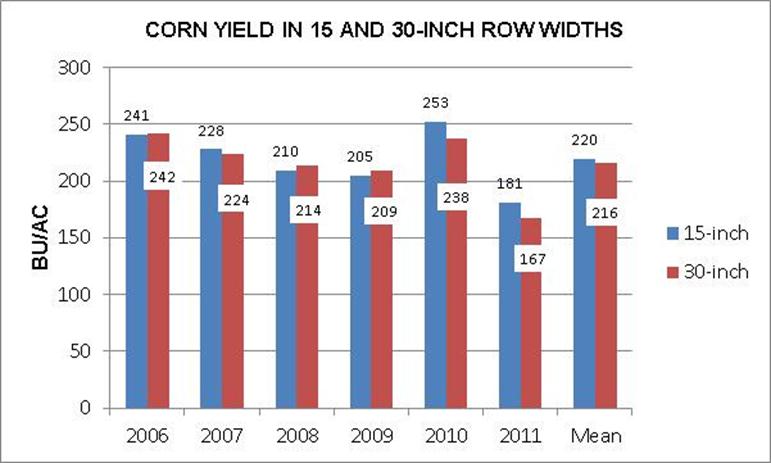
Figure 1.
The effect of row width on corn grain yield from 2006
to 2011 at the Oakes Irrigation Research Site.
Material and methods
Table Report 2011 Home page
Energy Beet Variety Trial
Figure 1.
Sugarbeet yields at the Oakes Irrigation Field Trials from 2006 to 2011.
Material and methods
Table Report 2011 Home page
Green Snap in Corn
Figure 1. The relationship between percent green snap and corn yield percent for 63 hybrids ranging from 85 to 101 day relative maturity at the Oakes Irrigation Research site in 2011.
Material and methods Green snap: Table Hybrid table Report 2011 Home page
Figure 2. The percent of yield loss per percent of green snap for three ranges of green snap percentages at the Oakes Irrigation Research Site in 2011.
Material and methods Green snap: Table Hybrid table Report 2011 Home page
Figure 3. The relationship between ear weight and plant population of viable ears after green snap at the Oakes Irrigation Research Site in 2011.
Material and methods Green snap: Table Hybrid table Report 2011 Home page
Figure 4. Corn hybrid silk date and percent green snap at the Oakes Irrigation Research Site in 2011.
Material and methods Green snap: Table Hybrid table Report 2011 Home page
Figure 5. Corn hybrid relative maturity and percent green snap at the Oakes Irrigation Research Site in 2011.
Material and methods Green snap: Table Hybrid table Report 2011 Home page
Nitrogen Management in Hard Red Spring Wheat Utilizing Remote Sensing
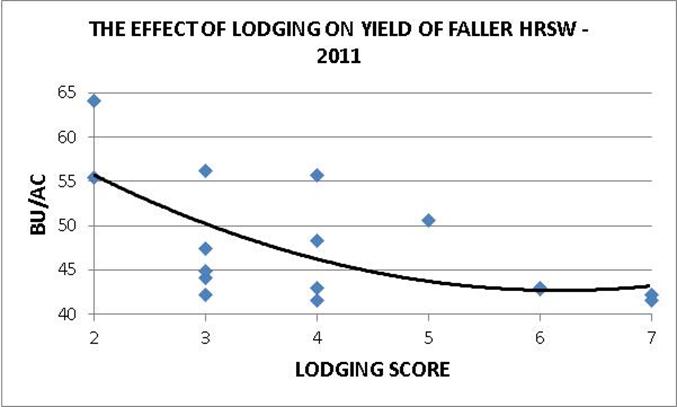
Figure 1. The relationship between lodging in Faller HRSW and yield at the Oakes
Irrigation Research Site in 2011.
Material and Methods Tables Report 2011 Home
page
Figure 2. Percent of maximum NDRE value for each treatment compared to the
critical level for sufficiency 96% at the Oakes Irrigation Research Site in 2011.
Material and Methods Tables Report 2011 Home
page
Potato Variety Nitrogen Rate Study
Figure 1. Dry
petiole nitrate-N vs critical values for Bannock Russet, Russet Burbank,
and Dakota Trailblazer potatoes at the Oakes Irrigation
Research Site in 2011.
Material and Methods Tables Results Report 2011 Home
page
Figure 2. Dry petiole nitrate-N vs critical
values in potatoes at the Oakes Irrigation
Research Site from 2010-2011.
Material and Methods Tables Results Report 2011 Home
page
Figure 3.
Petiole sap nitrate-N vs critical values for Bannock Russet, Russet
Burbank,
and Dakota
Trailblazer potatoes at the Oakes Irrigation Research Site in 2011.
Material and Methods Tables Results Report 2011 Home page
Figure 4. The
effect of N rate on percent of maximum chlorophyll meter reading
means for Bannock Russet, Russet Burbank and Dakota
Trailblazer potatoes at the
Oakes Irrigation Research Site in 2011.
Material and Methods Tables Results Report 2011 Home page
Figure 5. The
effect of N rate on percent of maximum NDRE means for Bannock
Russet, Russet Burbank and Dakota Trailblazer potatoes
at the
Oakes Irrigation Research Site in
2011.
Material and Methods Tables Results Report 2011 Home
page
Figure 6 The percent of maximum NDRE for
Bannock Russet, Russet Burbank and
Dakota Trailblazer potatoes versus yield averaged for
8-4-10 and 7-22-11 at the
Oakes Irrigation Research Site from 2010-2011.
Material and Methods Tables Results Report 2011 Home
page
Figure 7. The
relationship between the mean percent of maximum NDRE on 8-4-10
and 7-22-11 and N Rate for Bannock Russet, Russet Burbank
and Dakota Trailblazer
at the Oakes Irrigation Research Site in 2011.
Material and Methods Tables Results Report 2011 Home
page
Strip-Till, Corn on Corn, Nitrogen Rate Study
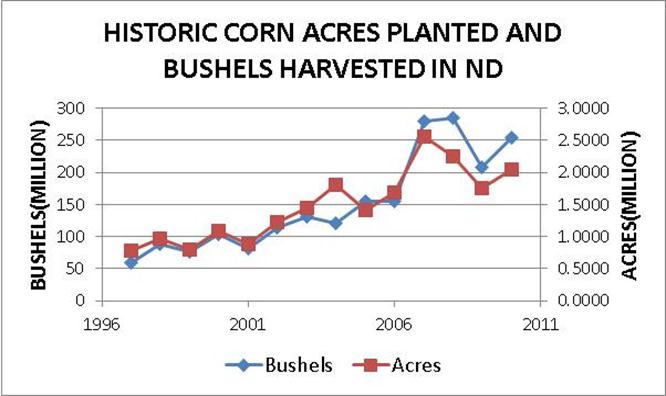
Figure 1. Acres
planted to corn and total bushels harvested from 1997-2011 in North Dakota.
Material and methods
Table Report 2011 Home page
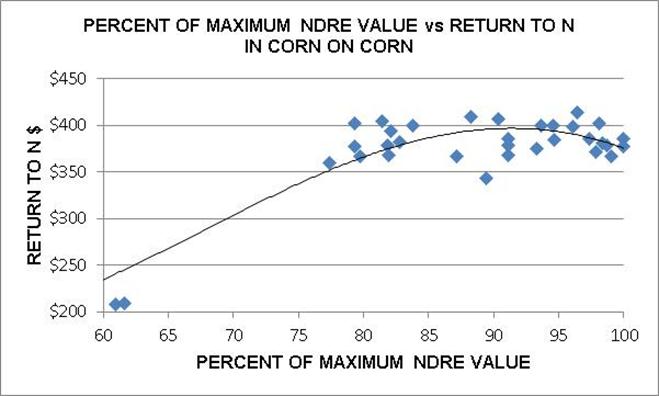
Figure 2 Return to N $ in relationship to the
percent of maximum NDRE values in late July from 2010-2011 in a corn on corn
rotation at the Oakes Irrigation Research Site.
Material and methods
Table Report 2011 Home page
 Figure 3. The relationship between the percent of
maximum NDRE values and fertilizer N rate in late July from 2010-2011, in a
corn on corn rotation at the Oakes Irrigation Research site.
Figure 3. The relationship between the percent of
maximum NDRE values and fertilizer N rate in late July from 2010-2011, in a
corn on corn rotation at the Oakes Irrigation Research site.
Material and methods
Table Report 2011 Home page
Strip-Till, Corn on Soybean, Nitrogen Rate Study
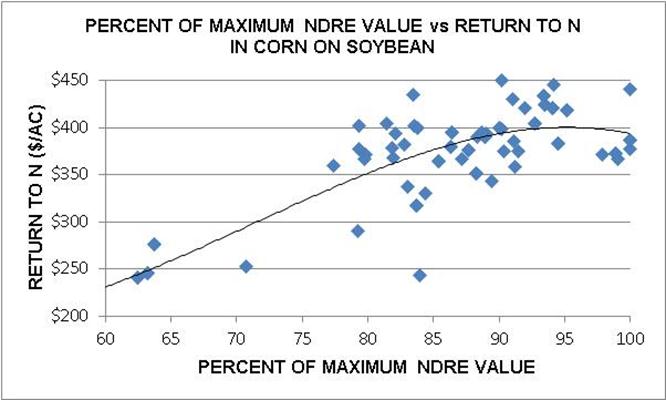
Figure 1. Return to N
$ in relationship to the percent of maximum NDRE values in late July from
2010-11 in a corn on soybean rotation at the Oakes Irrigation Research Site.
Figure 2. The relationship between the percent of
maximum NDRE values and fertilizer N rate in late July from 2010-11, in a corn
on soybean rotation at the Oakes Irrigation Research site.
Material and methods
Table Report 2011 Home page
Optimum Corn Stover Removal for Biofuels and the Environment
Figure 1. Ethanol production in the United States from corn grain from 2006 to 2011.
Material and Methods Results Report 2011 Home page
Figure 2. The net return when the fertility cost leaving the field is subtracted from the yield advantage in 100 percent removal plots compared to 0 percent removal plot from 2008 to 2011 at the Oakes Irrigation Research Site.
_________Tables______
Material and Methods Corn/corn Corn/soybean Results Report 2011 Home page