Oakes Irrigation
Research Site
Carrington Research Extension Center * North Dakota State University
P.O.
Box 531, Oakes, ND 58474-0531, Phone: (701) 742-2744, FAX: (701) 742-2700,
E-mail: Walter.Albus@ndsu.edu
The Response of Three Potato
Cultivars to Nitrogen Rate
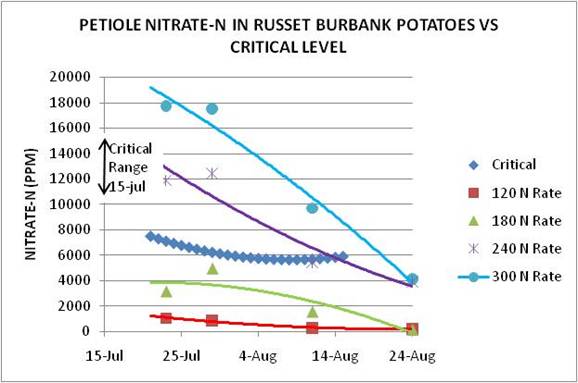
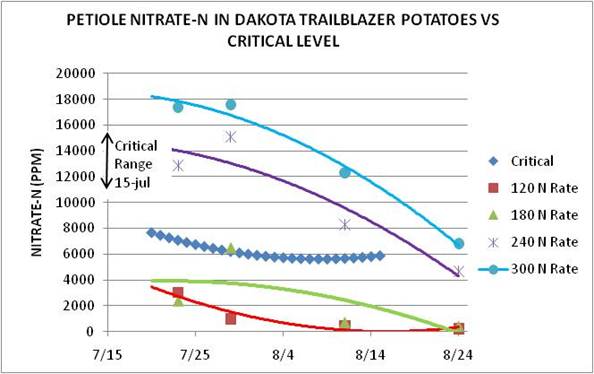
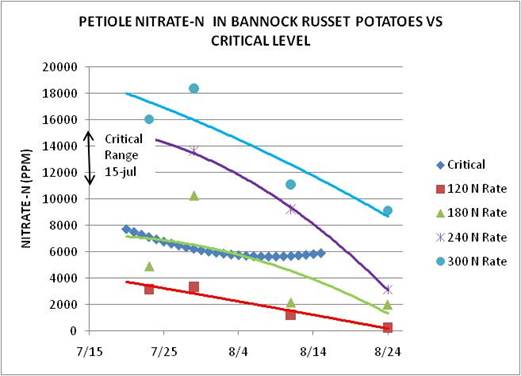
Figure 1.
Petiole nitrate-N vs critical values for Russet Burbank, Bannock Russet and
Dakota Trail Blazer potatoes at the Oakes Irrigation Research Site in 2010.
Material and Methods Tables Results Report 2010 Home
page
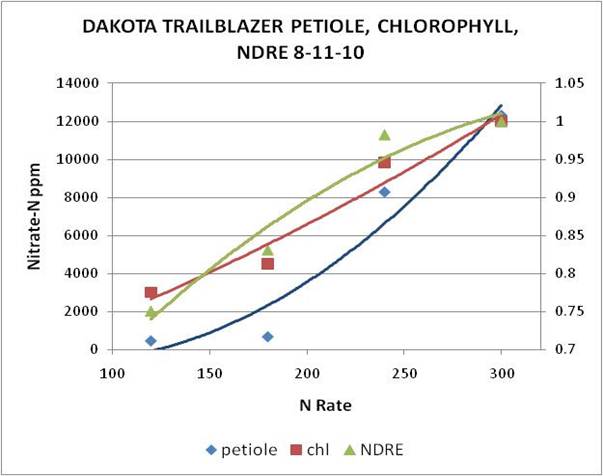
Figure 2. The relationship among chlorophyll meter reading,
canopy vegetation index(NDRE) and petiole nitrate-N on
August 11, 2010 at the
Oakes Irrigation
Research Site.
Material and Methods Tables Results Report 2010 Home page
Strip-Till,
Corn on Corn, Nitrogen Rate Study
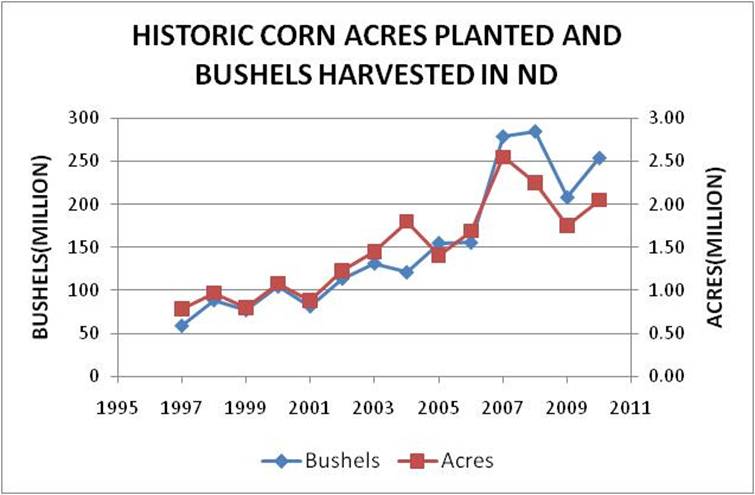
Figure
1. Acres planted to corn and total bushels harvested from 1997-2010 in
North Dakota.
Material and methods
Table Report 2010 Home page
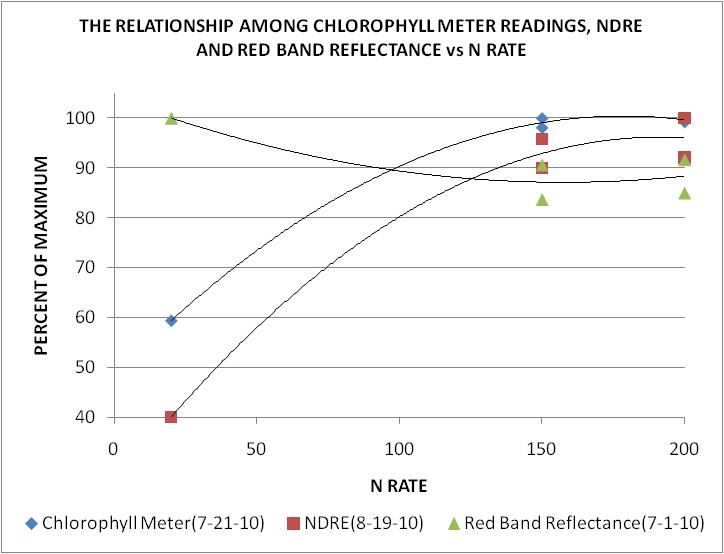
Figure 2. Relationship among chlorophyll meter
readings, NDRE, red band reflectance
and N Rate at the Oakes Irrigation
Research Site in 2010.
Material and Methods
Table Report 2010 Home page
Optimum Corn Stover Removal for Biofuels and the Environment
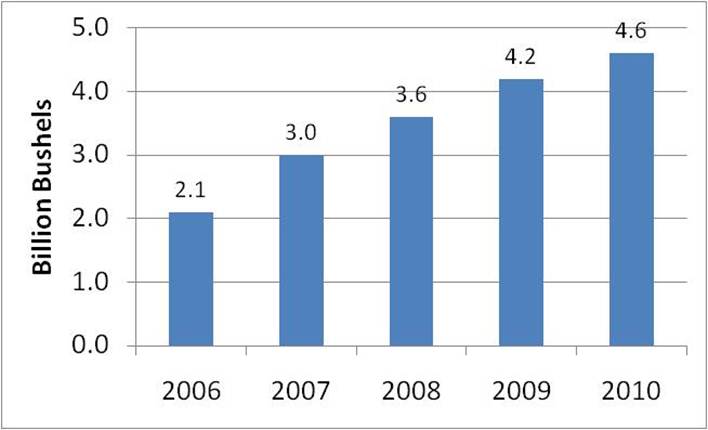
Figure 1. Amount of corn grain used for
ethanol production in the USA from 2006-2010.
Material and Methods Results Report 2010 Home page
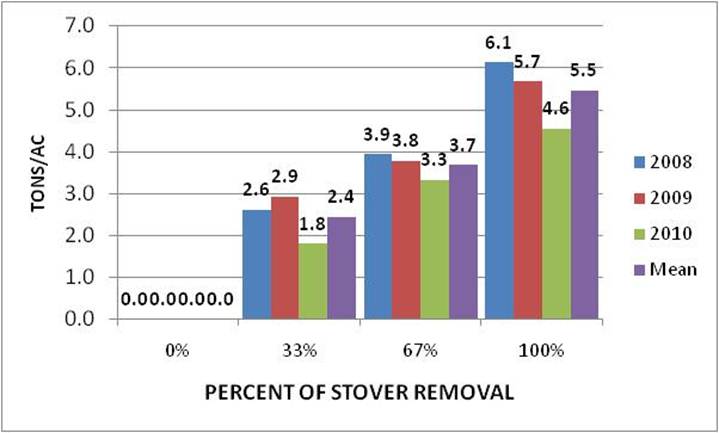
Figure 2. Stover
removal in tons of DM per acre in continuous corn at the Oakes
Irrigation
Research site from 2008-2010.
Material and Methods Table 2010
Results Report
2010 Home page
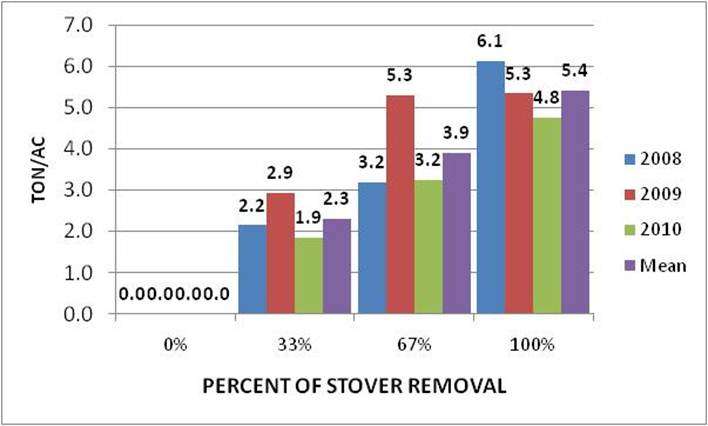
Figure 3. Stover
removal in tons of DM per acre in a corn on soybean cropping
system at the Oakes
Irrigation Research site from 2008-2010.
Material and Methods Table 2010 Results Report 2010 Home
page
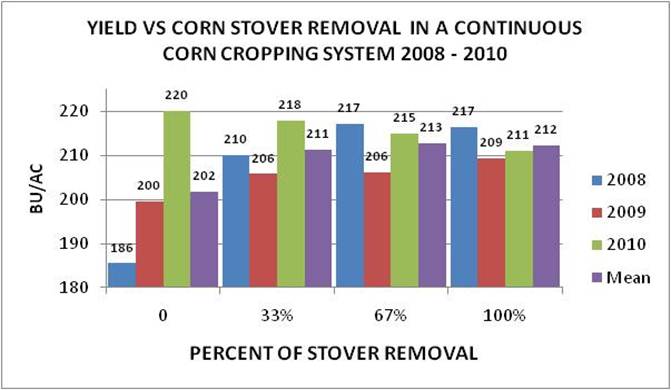
Figure 4. Yield vs corn
stover removal in continuous corn at the Oakes
Irrigation Research site from 2008-2010.
Material and Methods Table 2010 Results Report 2010 Home page
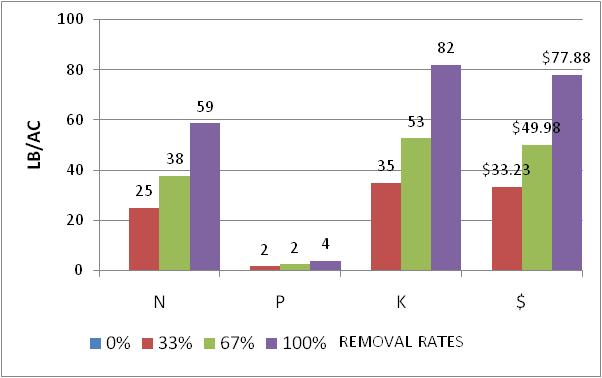
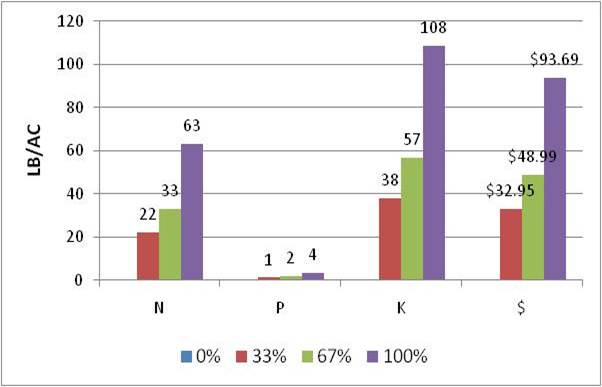
Figure 5. Amount of nutrients removed at three removal
rates and nutrient Figure
6. Amount of nutrients removed at
three removal rates and nutrient
value
in continuous corn at the Oakes Irrigation Research site in 2008. value in a corn soybean
rotation at the Oakes Irrigation Research site in 2008.
Material
and Methods Results Report 2010 Home
page
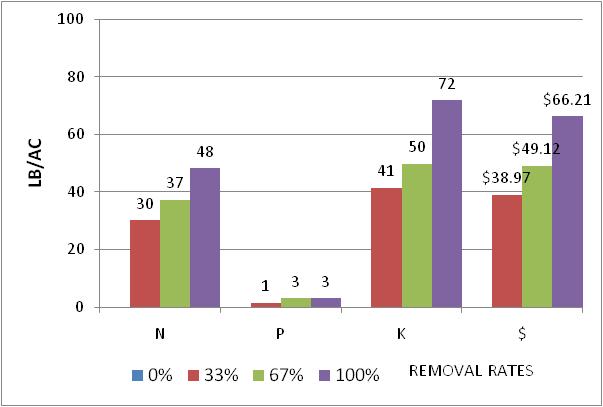
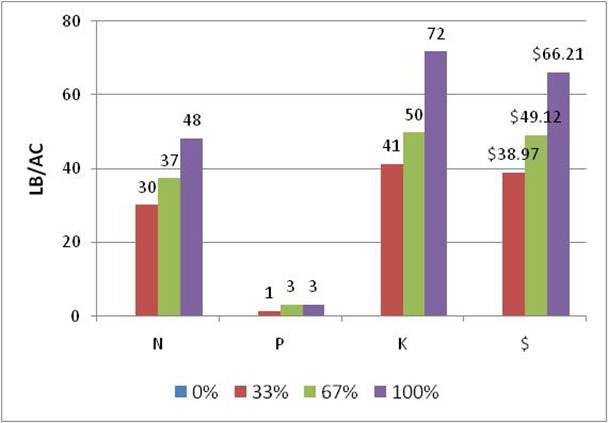
Figure 7. Amount of
nutrients removed at three removal rates and nutrient Figure 8.
Amount of nutrients removed at three removal rates and nutrient
value in continuous corn at the Oakes Irrigation
Research site in 2009.
value
in a corn soybean rotation at the Oakes Irrigation Research site in 2009.
Material
and Methods Results Report 2010 Home
page
FARM EXTENSION ACTIVITIES
Figure 1. The yield for irrigated continuous corn for ten site years Figure 2. The return to fertilizer N for irrigated continuous corn for ten site
(Oakes data set) at N fertilizer rates. years (Oakes data set).
Material
and Methods Focus of 2010 and future research
activities Report 2010 Home page
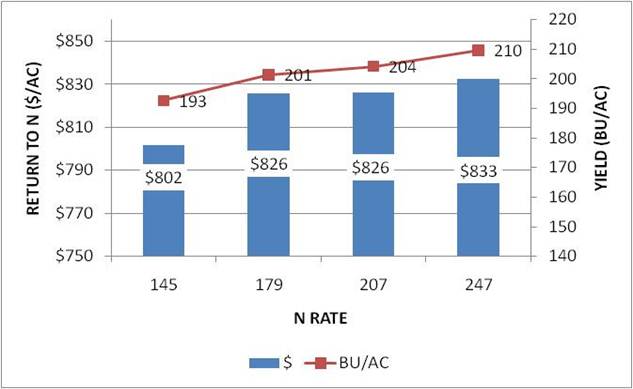
Figure 3. Yield
and return to N fertilizer for N rate means from 2006 to 2009
in irrigated corn on corn in twelve farm fields
at Oakes, ND.
Material
and Methods Focus of 2010 and future research
activities Report 2010 Home page
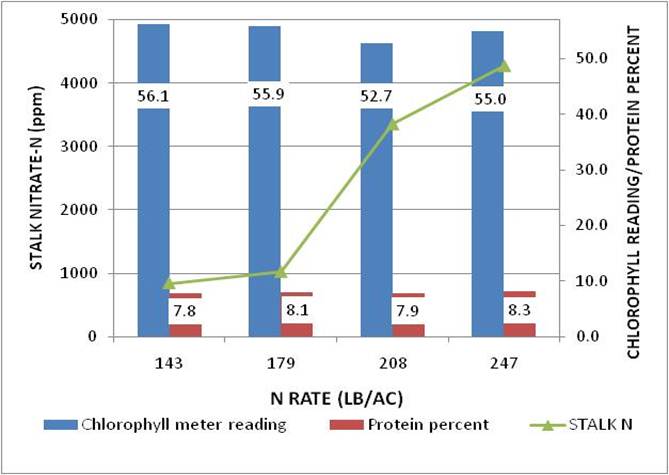
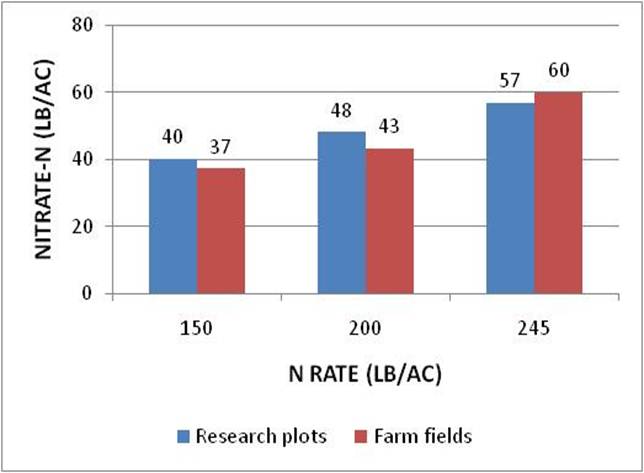
Figure 4. Chlorophyll meter readings, grain protein percent and basal stalk Figure 5. Residual soil nitrate-N for 0-2 or 0-3 feet depths for twelve farm
nitrate-N from 2006 to 2009 in irrigated corn on corn in twelve farm fields fields from 2006 to 2009 and research plots (10 site years) from 1979-84,
at Oakes, ND. 1991
and 1994-95.
Material and Methods Focus of 2010 and future research
activities Report 2010 Home page
Figure 6. The yield range at N rates for continuous irrigated corn for nine Figure 7. Nitrogen effeciency in lb/bu for continuous irrigated corn
years at Oakes. for nine years at Oakes.
Material and Methods Focus of 2010 and future research
activities Report 2010 Home page
R2=0.80
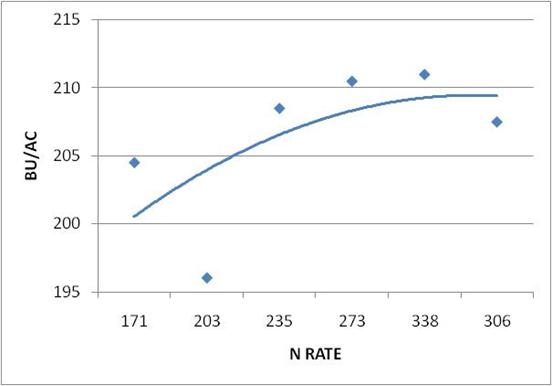
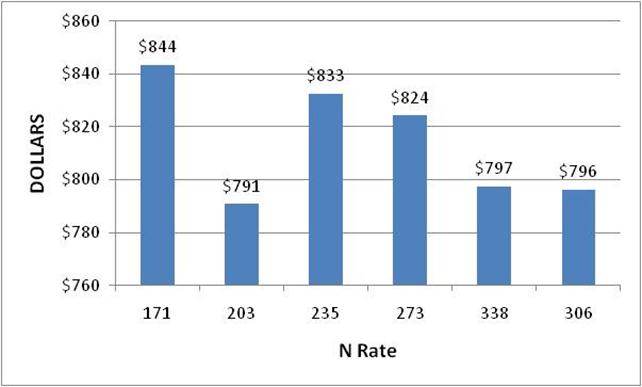
Figure 8. Field harvested corn yield versus N rate in
field 1 at Figure 9. Return to N
versus N rate in field 1 at Oakes, ND, in 2010.
Oakes, ND in 2010.
Material and Methods Focus of 2010 and future research
activities Report 2010 Home page
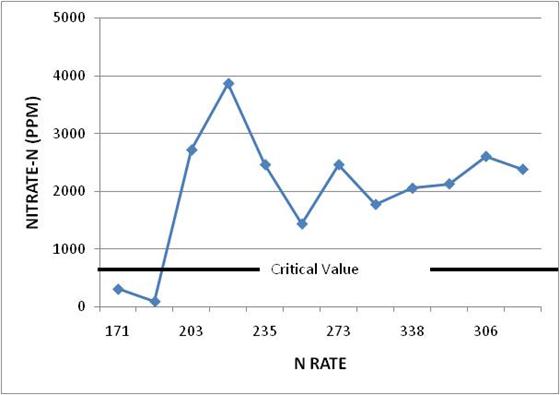
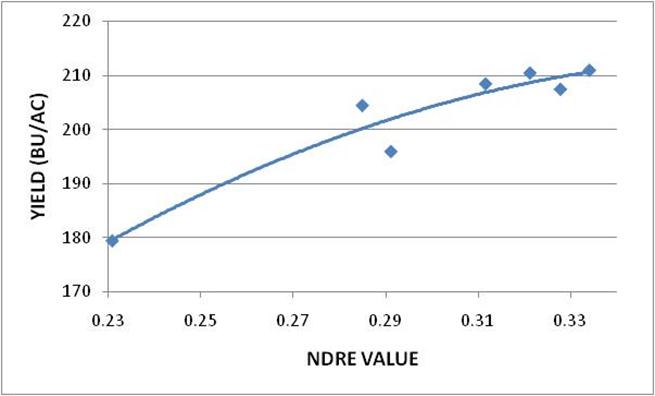
Figure 10. Basal stalk nitrate-N versus N rate in field 1 at Figure 11. The relationship between yield and NDRE in field 1 at
Oakes, ND, in 2010. Oakes, ND, in 2010.
Material and Methods Focus of 2010 and future research
activities Report 2010 Home page
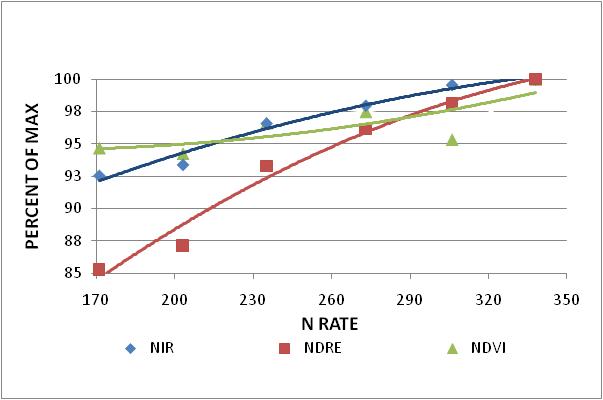
Figure 12. The percent of red edge, near infrared (NIR), normalized
difference red edge (NDRE) and normalized difference vegetative index
(NDVI) compared in field 1 at Oakes, ND, in 2010.