
Managing Saline Soils in North Dakota (SF1087, Revised Sept. 2019)
Availability: Web only
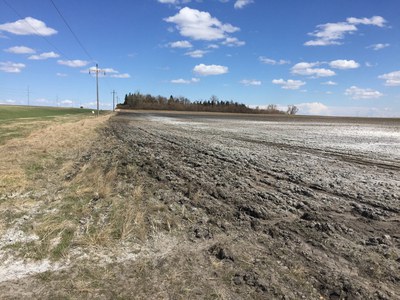
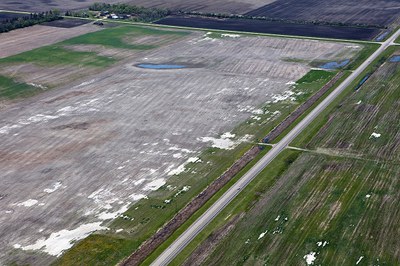
(NDSU Photo)
Saline Soils
Saline soils contain salts in great enough abundance that crop yields suffer and sometimes makes successful crop production impossible. Excessive salts injure plants by disrupting plant water uptake and interfering with the uptake of nutrients essential for plant growth and development.
Saline soils often are referred to as “salty,” “sour” or “alkali” by farmers and landowners; however, the proper name for these soils is “saline.” The soil test used to characterize saline soils from nonsaline soils is the soil EC test. The EC is the acronym for “electrical conductivity,” which is the laboratory method relating electrical conductivity of a current through a soil with salts in the soil solution, called “soluble salts.”
Nearly all North Dakota soils have salt EC values greater than zero. Recent North Dakota experiments indicate that soils with an EC value greater than 0.2 millimho per centimeter (mmho/cm) — the common term of electrical conductance used by soil scientists — have a negative effect on most North Dakota crops. A mmho/cm is equivalent to a deci-siemen/meter (dS/m), so 0.2 mmho/cm is equivalent to 0.2 dS/m.
A salt is any compound that is a product of the reaction of an acid with a base. Sodium chloride (table salt, or NaCl) is a salt. Gypsum (calcium sulfate, or CaSO4), epsom salts (magnesium sulfate, or MgSO4) and glauber salts (sodium sulfate, or NaSO4) are salts. Calcium chloride (CaCl2), magnesium chloride (MgCl2) and lime (calcium carbonate, or CaCO3) also are salts.
Of this list, all are soluble salts except for lime. Calcium carbonate is weakly soluble — about 100 times less soluble than gypsum — so it is not characterized as a soluble salt and does not contribute to salinity in soils.
In general, chloride salts are most active with respect to their negative effect on crop production. A soil with EC dominated by chloride salts will result in lower crop yield, compared with a soil with similar EC dominated by sulfate salts.
Salts are the product of the mineral geology of North Dakota, the semiarid climate has lasted for thousands of years, and mineral weathering. The underlying bedrock in North Dakota is shale. Shale is a sedimentary rock developed from ancient muds released through regional soil erosion and deposited millions of years ago in shallow seas.
Nearly all of North Dakota was covered by a shallow ocean within the past 100 million years, and the erosion of the surrounding landscapes deposited clays into the ocean to great depths. With time and pressure from overburden, the mud, along with all the minerals that were a part of the sediment deposits, including a great deal of sodium from the ocean saltiness, turned to rock.
North Dakota has experienced several glaciations within the past 100,000 years. Each of these glaciers has moved ground limestone and granite from rocks from what is now Canada into North Dakota and left these materials behind.
Clays, silts, sands, gravel and rocks are the product of glacier deposition. A glacier may appear to be like a bulldozer, but the ice is so deep and the pressures within it so extreme that the ice slowly churns internally, mixing disturbed sediments within the glacial ice.
From a distance, a glacier looks pristine and clear blue, but close-up, the ice is very dirty. After the ice age glacial melt, this region has become semiarid, with annual precipitation ranging from about 22 inches in the east to as low as 14 inches in the west. The lack of precipitation, particularly during the summer months of high evaporation, has resulted in many closed-basin landscapes with limited surface runoff into major streams and rivers.
The frequency of streams and rivers in the state is very low, compared with that of regions to our east. The lack of clear drainage paths results in locally high water tables, which are expressed as “potholes” in the central region of North Dakota.
The dominant soluble salts in North Dakota are sulfate-based: calcium sulfate, magnesium sulfate and sodium sulfate. In some areas, chloride salts are dominant. That is particularly the case west of Grand Forks, where artesian flows from deep geologic sediments contain high levels of sodium chloride and other chloride salts due to their ancient ocean origins.
A soil continuously is changing. Salts are brought to the soil surface (discharge) or leached to deeper depths (recharge) as a result of evapotranspiration and the amount and timing of rainfall.
This may seem counterintuitive, but salinity becomes worse in years of wetter-than-normal weather, and it is the worst when the weather turns dry immediately following a series of wet years. The extent of salinity is reduced if dry weather persists for years.
For example, in a survey of farmers from Hettinger County who experienced a series of wetter-than-normal years immediately before a 1968 survey, 51% of the farmers reported that saline soils appeared since 1960. More recently, many North Dakota farmers have noted severe salinity that developed in their fields since the most recent wet period that began in 1992.
A water table is defined as the depth of soil where the soil is saturated with water. This is usually not the depth of water where one might drill a well, but it is the layer that has potential to feed water into the root zone or even to the soil surface, depending on the depth.
The water table depth is important because most of the ground water in North Dakota immediately at and below the water table has high levels of dissolved salt. During periods of dryness, particularly in this region where the summer evapotranspiration is greater than seasonal rainfall, the water moves via capillary action upward.
The upward distance the groundwater can travel is directly related to the size of sediments (soil texture) it travels through, but it also is restricted by soil cracks when present. Figure 1 illustrates the relative rise of groundwater in soils from sands to silt loams.
In loams and clay loam soils, the capillary rise can be as much as 15 feet above the water table (Knuteson et al., 1989). In silt loam soils, the capillary rise can be as much as 9 feet from the water table, while in sands it may rise only 2 feet.
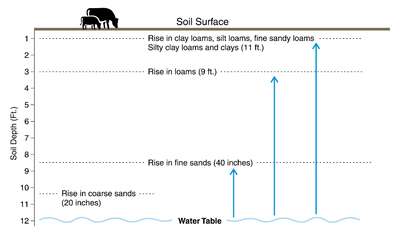
Figure 1. Capillary rise of water from the water table in a silt loam, compared with a sand.
Clay texture theoretically would have the greatest capillary rise, but in the field, clay-textured soils (particularly those with a high smectite clay chemistry composition), crack when dry, and the cracks are a barrier to capillary rise. Therefore, in North Dakota, the greatest capillary rise is usually in silt loam to very fine sandy loam soils because they have small pore sizes and they do not crack substantially.
Development of soil salinity is a product of soil water movement from “recharge” areas to “discharge” areas. Recharge areas are where water soaks into soil in greater quantities than other nearby areas, and recharge soils tend to be leached of salt because the general movement of water is downward. Discharge areas are soils where the salts reach the surface through upward capillary water flow or lateral flow along a soil matrix discontinuity in rolling terrain (Figure 7).
The patterns of saline soils in fields can be categorized as:
- Roadside or pond-side salinity (Figure 2a)
- General salinity development in relatively flat landscapes on higher elevations (Figures 3 and 4)
- Hillside seeps due to water movement impeded by a limiting layer (Figure 5)
Salinity develops along roadsides because the sediments under the roads are compact and do not allow surface water or groundwater to move to the opposite side of the water movement direction. The water “stacks up” on the “waterward” side of the road (the side where the water source is).
Also, road ditches are common alongside roads, even if the water in the ditches flow to nowhere. Road ditches hold water for days and sometimes weeks.
The ditches act like a long, narrow pond. The water moves down the ditch bottom, and because it cannot move under the road, it moves through capillary action back into the field, and then capillary rise moves the water toward the soil surface with the salts it collects from the soil along the way. The water evaporates near or at the surface and salinity results.
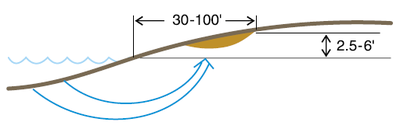
Figure 2a. Saline soil development near shallow streams, road ditches and sewage lagoons.
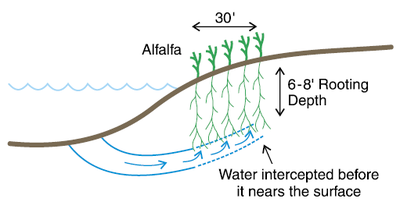
Figure 2b. Use of a 30-foot alfalfa strip along borders of shallow stream, road ditch or sewage lagoon prevents fringe salt deposition.
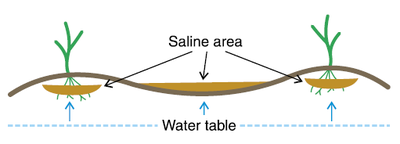
Figure 3. Saline development in a nearly level landscape with a shallow, saline water table. Continuous cropping will help decrease development.
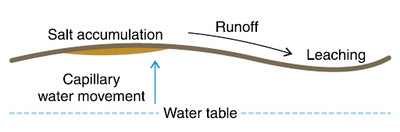
Figure 4. Saline development on a high clay content, subtly undulating landscape. Salt accumulates on high clay content ridges, while the low spots are leached of salts. Continuous cropping will help lower water table and stop salinity development.
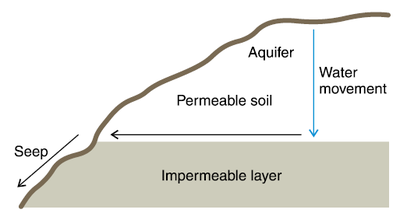
Figure 5. Saline seep development.
In coarser-textured soils, the salinity develops closer to the ditch. In loam soils, the salinity develops 30 to 50 feet from the ditch, and in finer-textured soils, the salinity develops 50 to 100 feet from the ditch.
A relatively low-salinity strip usually occurs immediately next to the ditch, and the salinity develops further into the field. The movement of water from ditch to field is an arc (Figure 2a), which results in the ditch low-EC/high-EC progression.
A management technique to remediate roadside salinity is to establish alfalfa at least 30 feet wide along the road or ditch in the lower-EC area (Figure 2b). Alfalfa is a “water hog,” using up to 25 inches of soil water every year and rooting at least 8 feet deep two years after establishment. Alfalfa roots act as a dam, so water moving from the ditch into the field is intercepted by the alfalfa.
Any water moving into the field beneath the reach of the alfalfa root will be too deep to move upward into the cropping root zone. This technique is very effective but requires that the soil next to the road/ditch is not subject to flooding because alfalfa is not tolerant of flooded conditions.
In the Red River Valley and other parts of the state where the landscapes are dominated by ancient lakebed sediments (lacustrine deposits), higher elevations that rise above the surrounding depressions, usually less than 6 inches difference in elevation, become saline due to lateral water movement from subtle depressions (Figures 3 and 4). The depressions accumulate runoff from rainfall too intense to infiltrate the higher elevations.
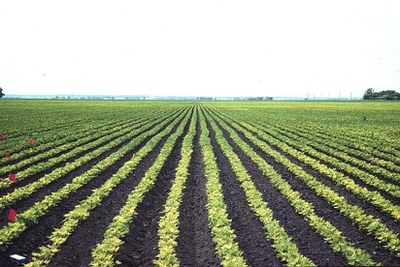
Accumulation of water in depressions happens often because movement through clay soils, such as the Fargo silty clay loam series, is at most 1/3 inch of water infiltration per day. Evidence for the pattern of water recharge in depressions and discharge on the “bumps” in the Red River Valley lies in the pattern of iron deficiency chlorosis (IDC) in soybean seeded in these fields.
The IDC results from the difficulty of soybean to take up iron in soils with a pH greater than 7 that have free carbonates. The carbonates are present because although lime is not classified as a soluble salt, it is slightly soluble, and through the centuries, the lime is deposited in the landscape “bumps” just as soluble salts are deposited for much shorter time periods (Figure 6).
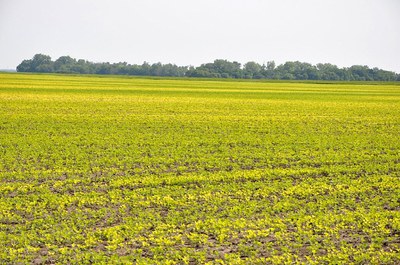
Figure 6. Soybeans with severe iDC in the Red River Valley, Bearden soils, near Amenia, N.D. Yellow soybeans are growing on the "bumps" of the landscape, barely 6 inches higher than the depressions. Free lime has accumulated on theses bumps, and following successive wet years, soil EC also is much higher in these areas. Greener soybeans are in the depressions. (NDSU Photo)
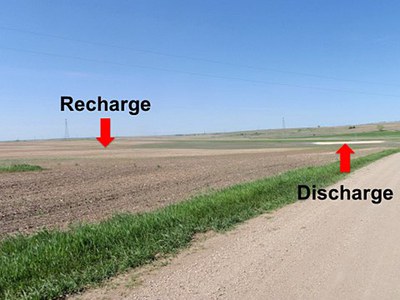
Figure 7. A saline seep along U.S. Highway 83 in North Dakota. The discharge area is where salts have accumulated. Water needs to be managed between the discharge and recharge area. (NDSU Photo)
West of the Red River Valley, saline seeps are common in hilly landscapes. Glacial soils exhibit “discontinuities” of textures within the soil matrix and parent material. Glaciers did not melt in a day, but for years and maybe centuries.
When water moved fast beneath the melt, sands fell out of the water. When the water moved more quickly, finer sands and silts were deposited, together with some clay that might have been fixed to the sands or silts. When the water ponded and was still, clays were deposited. The result is that many hill sediments have layers of sediments of varying textures.
When water moves downward through soil, it moves as a response to gravity. If the water encounters a different texture — from loam to clay, clay to loam or sandy to loamy — the water does not move immediately into the new texture. It has to reach 100% pore saturation before it can move into the new texture.
Once it approaches 100% pore saturation, the water tends to move along the texture change surface downward. If the discontinuity is near the hillside, the water, along with the salts it carries, comes out of the hill, and the hillside discharge develops a saline soil that we call a “saline seep” (Figure 5).
Soil Testing for Salinity
Soils that are severely salt-affected usually have a bright white, crusty appearance when dry. However, the severity of salinity extends well beyond the obvious area. In soils that are wet, the white crust is not seen. This is because the salts are in the soil solution.
Soils also can have high enough EC values just below the soil surface to reduce crop production severely without having the white surface appearance. The extent and severity of salinity only can be diagnosed and mapped using soil testing, or an EC sensor or EM (electromagnetic) sensor proxy (Figures 8 and 9).
Commercial soil testing laboratories in this state use the electrical conductivity (ECa) of a 1:1 soil:water extract to measure salt activity. Laboratories use strict procedures and utilize check samples to ensure precision and accuracy of their analysis. The laboratory methods used in North Dakota are recommended by the regional soil testing committee NCERA-13. The methods are published at: http://extension.missouri.edu/explorepdf/specialb/sb1001.pdf.
Some laboratories, and nearly all scientific soil salinity publications, use the saturated paste method of salt analysis. This method can be at least 10 times more expensive to use, and the method is more time-consuming to perform.
Recent NDSU studies have shown that for many soils, we have a reasonable conversion formula from the 1:1 EC values to a saturated paste EC value. The r2 (correlation coefficient) values of the relationships below in North Dakota were 0.90, but the relationship from South Dakota samples was 0.82 when outliers to the data were removed (Matthees et al., 2017).

Personal handheld EC sensors are available through farm supply catalogues. The handheld EC sensors are easy to use in the field for quick diagnosis.
Values from handheld EC sensors should be calibrated with lab results to directly relate their values to published values from lab methods. A great variability occurs in the EC readings from different hand-held EC meters (Briese, 2010).
Differences also occur with soil temperature in EC values from hand-held instruments. These instruments probably are best used qualitatively to demonstrate soil EC differences within fields to confirm that salinity is the issue affecting crop production.
To improve accuracy, handheld EC meters should be calibrated routinely with a standard calibration solution. When testing soils, distilled water should be used because tap or well water likely has salts that can falsify the soil test. However, they are not a substitute for laboratory analysis if one doesn’t put the effort into calibrating the instrument with laboratory results.
Other qualitative instruments for mapping field EC ranges are the Veris 3100 soil EC sensor (Figure 8) and the Geonics Ltd. EM-38 (Figure 9). The Veris 3100 measures EC, and the results may be calibrated to laboratory EC analysis with measurement of soil moisture at the time of sensing.
Figure 8. Veris 3100 EC sensor in use. (Courtesy of Veris Technologies, Salina, Kan.)
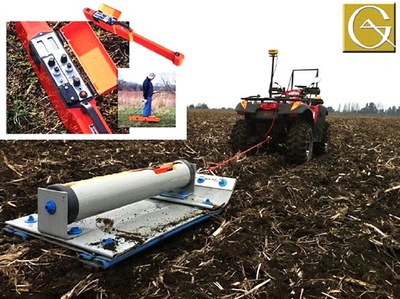
Figure 9. EM38 in use. (Courtesy of Geonics Ltd., Mississauga, Ontario)
The EM38 maps EC through electro-magnetic conductance. Electricity and magnetism are mathematically related, so the maps developed from each will be similar. The Veris has to penetrate the soil and the EM38 does not.
Salinity Management
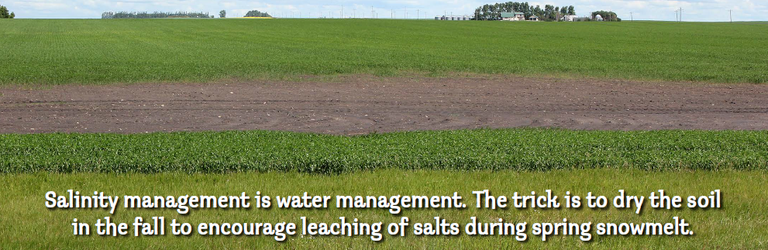
Salinity management is water management. Practices should dry the soil so capillary rise is minimized and leaching is maximized. Cultivating increases soil salinity by turning a field darker in color, increasing capillary rise and decreasing leaching from destroying macropores. Practices include planting salt-tolerant cash crops, full-season salt-tolerant cover crops and late-season cover crops (after small-grain harvest); perennial cropping; and drainage (ditch management and subsurface drainage).
Mapping
The goal of salinity management should be to reduce soil salinity to a level that allows profitable crop production. Ignoring acres affected by salinity in a field results in wasteful expense for seed, fertilizer and pesticides, and the profitability of the field as a whole is reduced. Therefore, the first step to salinity management is to map the field for EC.
The best sampling strategy is to sample in zones. A good template for a zone map may be multiyear yield maps and satellite/aerial imagery. Crops are good indicators of relative EC levels, and the patterns of reduced yields can be used to guide zone sampling effectively. Also, soil EC or EM sensor maps are effective if the equipment is available for use or hire (Franzen, 2018).
(NDSU Photo)
Crop Selection
The reason high soil salinity is present is because of water tables too close to the soil surface. As soil EC increases, its effects are amplified and the area affected grows larger because crop water use decreases as crop growth decreases.
The problem ”feeds on itself” because salinity breeds more due to low crop water use at the fringes of the area of high salinity. The importance of having something growing that is tolerant to the salinity present cannot be overemphasized.
Great advances have been made recently in our understanding of the tolerance of North Dakota-adapted wheat, corn and soybean cultivars to soil EC. The values that appear in this publication are meant as a general guide. A variability of tolerance to soluble salts occurs within each crop type.
Wheat
Spring wheat, durum and winter wheat have a similar tolerance for salinity. The soil salinity work in North Dakota has focused on spring wheat. As Figure 10 illustrates, some yield reduction occurs with 1:1 EC greater than 0.2 (mmho/cm; dS/m). The yield reduction continues to about 85% of maxiumum at EC 2 and 70% at EC 4, but the reduction in productivity is very large at EC values greater than 5. From about 60% yield potential at EC 5, productivity falls to less than 20% at EC 8.
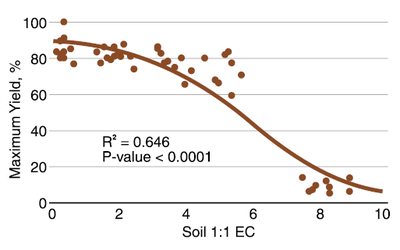
Figure 10. Relationship of spring wheat relative yield and soil 1:1 EC values. (Thapa et al., 2016)
Corn
Corn is more sensitive to soil salinity, compared with wheat (Figure 11). At an EC of 0.2 (mmho/cm; dS/m), relative yields average about 100%, with considerable variability greater and less than 100% of about ± 15%. That level of tolerance persists until the soil reaches EC 1. At EC values from 1 to 2, relative yields decrease about 10%. From EC 2 to 3, relative yields decrease about 10%, and at EC greater than 3, for every 1 EC unit, yields continue to decrease about 15%. At EC 5, yields decline to 20%.
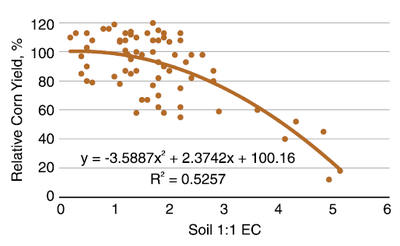
Figure 11. Relationship of field corn relative yield and soil 1:1 EC values. (Butcher et al., Franzen unpublished data, 2008)
Soybean
Soybean is more sensitive to salinity than corn, canola, sunflower or wheat. (Figure 12). From EC 0.2 (mmho/cm; dS/m) to 0.8, the average relative soybean yield is about 95%. At an EC value of 1.5, relative yield falls to about 80%. At an EC of 2.2, relative yield declines to 60%. Producers have little hope of raising a profitable soybean crop at EC values greater than 3.
In addition, the presence of iron deficiency chlorosis (IDC) reduces yields more than indicated on Figure 12. Soils with greater than 10% free lime at the surface, with EC values of 2 and favorable environment for IDC (cool, wet conditions) have resulted in less than 20% relative yield in field trials.
Considerable variability in tolerance occurs in IDC and soil EC in soybean cultivars. Generally, cultivars tested in this region with high IDC tolerance also tend to be more tolerant to high EC because North Dakota cultivar screening trials evaluate both simultaneously in the field and in greenhouse studies.
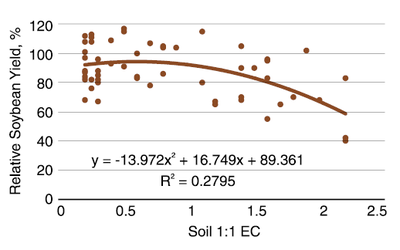
Figure 12. Relationship of soybean relative yield and soil 1:1 EC values. (Butcher et al., 2016)
Barley
Barley has greater salt tolerance, compared with most other crops adapted to the North Dakota environment. Recent work in Canada and Spain shows that barley yield response is similar to the relationship in Figure 13.
Yields of barley are almost unaffected by salinity until 1:1 EC of 2 in sulfate-dominated systems. However, in chloride-dominated systems, yield decreases with EC values greater than 1. Most soil EC in North Dakota, with the exception of the area west of Grand Forks, is sulfate dominated.
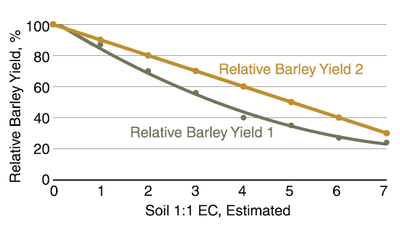
Figure 13. Relative six-row barley yields from two experiments in a chloride-dominated system. [Experiment 1 Steppuhn and Raney (2005); Experiment 2 Bole and Wells (1979)]
Oats
Canadian research indicates that oats are nearly as salt tolerant, and depending on cultivar, sometimes superior to that of barley (Figure 14). Oat productivity was at 50% that of yield in a nonsaline soil at 1:1 EC of 11. Barley productivity was slightly greater at EC values greater than 8.
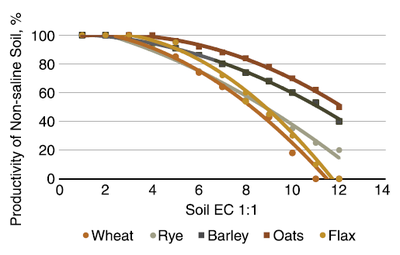
Figure 14. Relative yields of spring/winter wheat, cereal rye, flax, barley and oats in a Saskatchewan experiment comparison. (Fowler and Hamm, 1980)
Canola
Canola salt tolerance is similar to barley except at EC greater than 2.5. Considerable variation occurs in salt tolerance among cultivars, however. Communication with the seed company technical staff would be helpful in avoiding those cultivars with less tolerance than required.
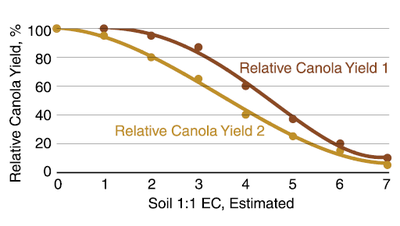
Figure 15. Relative canola yield response from two different cultivars to estimated 1:1 soil EC in a sulfate-dominated system. (Steppuhn and Raney, 2005)
Sunflower
Sunflower usually is referred to as moderately salt tolerant, yet it successfully competes with higher EC-rated barley for acres that are grown to yield. The initial response of sunflower to soil salinity is a low-threshold salinity. This means that with an EC of 1, the potential yield drops by 5%.
The general relationship between sunflower seed yield and soil EC is shown in Figure 16. Sunflower may be helpful in saline soil management once the EC is reduced through the use of more salt-tolerant crops because it will dry the soil to deeper depths. However, it would not be the first crop to seed on soils with EC greater than 5.
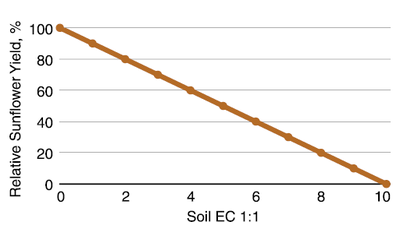
Figure 16. General relationship between sunflower seed yield and soil EC. Much variation occurs among cultivars from this relationship. (Katerji et al., 2000)
Field Pea
Of the state-grown, nonsoybean annual legumes of greatest acreage, field pea is the least tolerant to salinity. Based on threshold salinity from studies in Canada, field pea suffers little yield loss at 1:1 EC (less than 0.3 mmho/cm.) From 0.6 on, field pea yield loss is about 15% for each unit of EC, as shown in Figure 17.
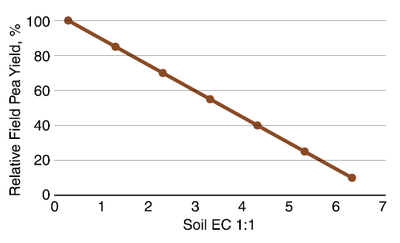
Figure 17. General relationship of field pea yield and soil EC. (Steppuhn et al., 2001)
Lentil
The threshold salinity for lentil is about 0.6 mmho/cm (1:1) (Figure 18). This varies with cultivar from about 0.35 to 1 mmho/cm. The EC for 50% yield is about 1.5, and can vary from about 1.25 to 1.75. The genetic variability of salt tolerance among lentil cultivars is much less than in chickpea and faba bean.
Chickpea and Faba Bean
The threshold salinity for chickpea and faba bean is about 0.75 mmho/cm (dS/m) (Figure 18). The EC for 50% yield of chickpea is about 2.3, while 50% yield of faba bean is about 2.5 mmhos/cm. A great genetic variability occurs in salinity tolerance within faba bean and chickpea cultivars.
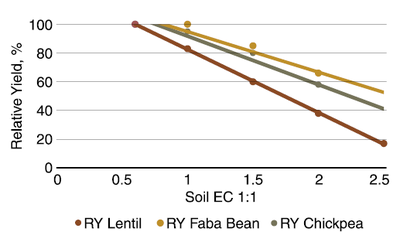
Figure 18. Average relationships of lentil, faba bean and chickpea cultivars with soil salinity in a Syrian experiment. (Rameshwaran et al., 2016)
Alfalfa
The threshold salinity for alfalfa in terms of a 1:1 EC is 1 mmho/cm (dS/m) (Figure 19). The relationship of alfalfa to increasing salinity is 100% – 14.5 (EC), or about 14.5% yield reduction for each additional unit of EC.
New “salt tolerant” alfalfa varieties are available commercially. These varieties do grow better in more saline areas than normal
varieties. However, if the EC1:1 is greater than 3 mmhos/cm, growth likely will be severely limited and a salt-tolerant perennial (Table 1) would grow better in that area.
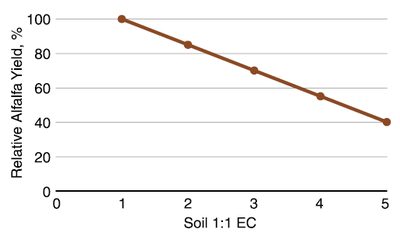
Figure 19. Relative alfalfa yield with soil salinity, California. (Ayers and Wescot 1985; Sanden and Sheesley, 2007; Stepphun et al., 2012)
Pinto Bean/Dry Edible Bean
Pinto bean and all dry edible bean are very sensitive to soil salinity. The threshold salinity is about 0.5 mmhos/cm, and for each 0.5 increment greater EC, the reduction in yield potential is about 20% (Figure 20). There is variation in EC tolerance between cultivars. Profitable yield of dry bean is unlikely at EC's greater than 1.5 mmhos/cm.
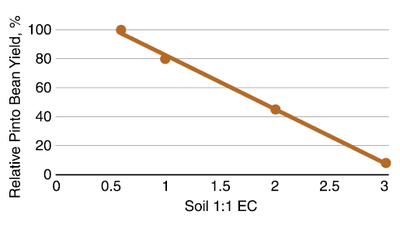
Figure 20. Relative pinto bean yield with soil salinity, Colorado. (Davis et al., 1998)
Rye (cereal)
Recent cover crop experiments support the previous findings that cereal rye is tolerant of moderate to severe salinity. Work by Francois et al. (1989) indicated that a threshold salinity for rye would be a 1:1 EC value of about 3.8 mmhos/cm. Relative yield still was about 30% at an EC of 7. A zero yield would be predicted by their work at an EC of 10.
The work by Fowler and Hamm (Figure 14) indicates that rye is similar to oats and barley in salt tolerance until the soil EC reaches about 6. The reduction in productivity with EC greater than 6 with each unit increase in EC is much greater in rye than in barley and oats.
Safflower
Safflower is remarkably adapted to highly saline soils. In a California experiment (Bassil et al., 2002), researchers found no differences in seed yield up to at least a 1:1 EC value of 3.5 mmhos/cm (dS/m), although plant height was reduced.
The crop was able to compensate for the higher salinity by reducing some parameters of growth, but the salinity did not affect yield. Other studies have noted that once soil EC (saturated paste) reaches 5, yield reductions are quite large. An EC of 6.5 had a yield reduction of 25%, compared with lower EC values.
Flax
Although flax is a Middle Eastern crop, its salt tolerance is less than it is for field corn. Perhaps this is because flax was grown for millennia in the Nile Valley, where low-salt water (the Nile) leached out salts from field soils before seeding.
The threshold salinity for flax is about 0.5 mmho/cm. The percent of relative yield with 1:1 EC is 10% with 0.6 mmho/cm (dS/m), 25% with 1 and 50% at 1.5.
The experiments performed by Fowler and Hamm (1980) indicate a greater tolerance to salts, with similar productivity to an EC of 3 (Figure 14), and 50% productivity to about EC 9. North Dakota field observations generally support its general intolerance to salt, as indicated in Table 1.
If the EC1:1 is greater than 4 mmhos/cm, salt tolerant forages provide a much greater chance of success than cash crops or salt tolerant alfalfas. However, the salt tolerant grasses may be slow to establish as by the time these are planted are in July or August and the grasses should be planted in May.
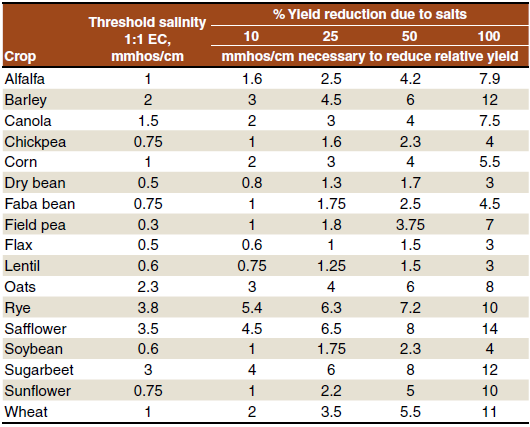
Table 1. Approximate threshold salinity values for field crops and percent reduction in yield due to salinity.
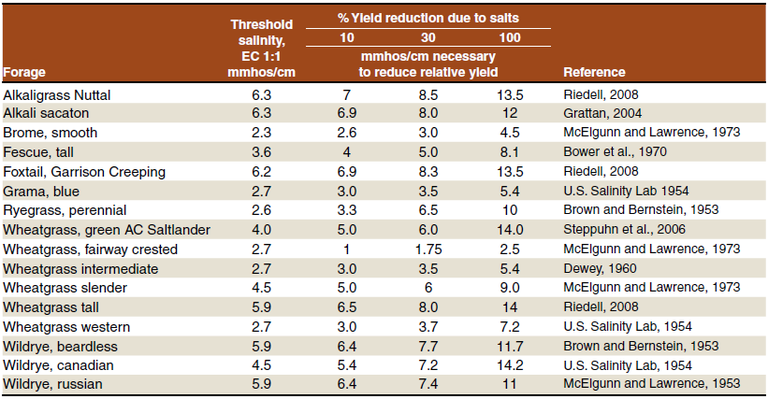
Table 2. Approximate threshold salinity values for forage grasses and percent reduction in yield due to salinity.
Tile Drainage
Tile drainage has helped reduce salinity in numerous North Dakota fields during the past 20 years (Figure 21). However, to be effective, the soil need precipitation in excess of crop demand for salts to leach from the field. If the growing seasons following installation of tile are relatively dry, little change will occur in EC values. Also, EC reduction in higher-clay soils is slow due to the slow movement of water through these soils and the strong capillary pull of water from deeper depths toward the soil surface.
In addition, some small areas (or large areas) within certain fields may contain high soil sodium values. Salts reduce the clay-randomization properties of sodium-affected soils. When soil salts (particularly gypsum) are reduced, the sodium properties become more strongly expressed. The soil will become hard when dry and too wet when even moderately moist.
To determine if these areas are present, have a sodium absorption ratio (SAR) analyzed on soil samples from the intended area, with particular attention to “odd” soils. The percent of the Na component of the soil base exchange capacity is a cheaper, but it is close to the more expensive SAR analysis.
Remediating sodic soils is possible should they appear after tiling, particularly if they are confined to small (less than an acre) areas. However, more extensive sodium problems may require more inputs than economically practical.
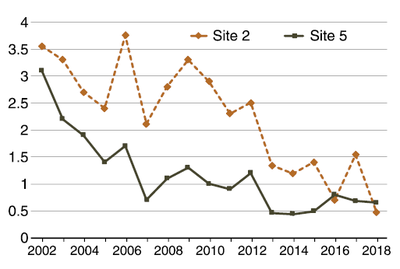
Figure 21. Soil EC (1:1) changes through time at two northeastern North Dakota sites due to tile installation. (Agvise data, used with permission)
General Recommendations for Improving Productivity in Saline Soils
- Manage the saline site as soon as you can. Otherwise, it will worsen and spread.
- Conduct soil sampling and EC/EM sensing to determine the soil EC values at the 0- to 6-inch and 6- to 24-inch depths and define the area affected. Sampling to the 3-foot and 4-foot depths also may be helpful in soils where conditions and equipment permit deeper sampling.
- Grow something throughout the growing season that is tolerant to the salt values present in the area. This might include seeding a cover crop following a small grain, or other short-season crop if more than 30 days of growing season remains.
- Monitor the EC in the area every year to determine progress and to see if a greater array of crop choices is possible.
- Establish an alfalfa buffer strip next to a ditch that is the source of salinity-feeding water if practical.
- Consider tile drainage if practical.
(NDSU Photo)
References
Ayers, R.S. 1977. Quality of water for irrigation. J. Irrig. Drain. ASCE 103:140.
Ayers, R.S., and D.W. Wescot. 1985. Water Quality for Agriculture. FAO Irrigation and Drainage Paper 29 Rev. 1, Reprinted 1989, 1994.
Bassil, E.S., and S.R. Kaffka. 2002. Response of safflower (Carthamus tinctorius, L.) to saline soils and irrigation II. Crop response to salinity. Agr. Water Mgt. 54:81-92.
Bole, J.B., and S.A. Wells. 1979. Dryland soil salinity: Effect on the yield and yield components of 6-row barley, 2-row barley, wheat and oats. Can. J. Soil Sci. 59: 11-17.
Bower, C.A., G. Ogata and J.M. Tucker. 1970. Growth of sudan and tall fescue grasses as influenced by irrigation salinity and leaching fraction. Agron. J. 62:793-794.
Brown, J.W., and L. Bernstein. 1953. Salt tolerance of grasses. Effects of variation in concentration of sodium, calcium, sulfate, and chloride. Report to Collaborators. U.S. Salinity Lab., Riverside, Calif.
Butcher, K., C. Heglund, T. DeSutter, A. Wick and J. Harmon. 2016a. Corn response to soil salinity. NDSU Extension Soil Health and Land Management publication. www.ndsu.edu/soilhealth/wp-content/uploads/2015/12/Corn-salinity_6-13-16.pdf (accessed February 2019).
Butcher, K., C. Langseth, T. DeSutter, A. Wick and J. Harmon. 2016. Soybean response to soil salinity. NDSU Extension Soil Health and Land Management publication. www.ndsu.edu/soilhealth/wp-content/uploads/2015/12/Soybean-Salinity_6-13-16.pdf (accessed April, 2019).
Butcher, K., A.F. Wick. T. DeSutter, A. Chatterjee and J. Harmon. 2018. Corn and soybean yield response to salinity influenced by soil texture. Agron. J. 110:1-11. Doi:10.2134/agronj2017.10.0619
Chen, M., Y. Kang, S. Wan and S. Liu. 2009. Drip irrigation with saline water for oleic sunflower (Helianthus annus L.) Agr. Water Mgt. 96:1766-1772.
Davis, J., G. Cardon and R. Waskom. 1998. Salinity issues in Colorado. Agronomy News 12 (6). Co. St. Univ. Coop. Ext. Serv. Fort Collins, CO.
Dewey, D.R. 1960. Salt tolerance of twenty-five strains of Agropyron. Agron. J. 54:353-355.
Flagella, Z., M.M. Giuliani, T. Rotunno, R. Di Caterina and A. De Caro. 2004. Effect of saline water on oil yield and quality of a high oleic sunflower (Helianthus annuus L.) hybrid. Eur. J. Agron. 21:267-272. Doi:10.1016/j.eja.2003.09.001
Fowler, D.B., and J.W. Hamm. 1980. Crop response to saline soil conditions in the Parkland area of Saskatchewan. Can. J. Soil Sci. 60:439-449.
Francois, L.E. 1996. Salinity effects on four sunflower hybrids. Agron. J. 88:215-219.
Franzen, D.W. 2018. Developing zone soil sampling maps. NDSU Extension publication 1176-2 (Revised).
Ghassemi-Golezani, K., N. Nikpour-Rashidabad and S. Zehtab-Salmasi. 2012. Physiological performance of pinto bean cultivars under salinity. Int. J. Plant, Animal, Env. Sci. 2:223-228.
Grattan, S.R., C.M. Grieve, J.A. Poss, P.H. Rovinson, D.L. Suarez and S.E. Benes. 2004. Evaluation of salt-tolerant forages for sequential water reuse systems. I. Biomass production. Agric. Water Mgt. 70:109-120.
Katerji, N., J.W. van Hoorn, A. Hamdy and M. Mastrorilli. 2000. Salt tolerance classification of crops according to soil salinity and to water stress day index. Agric. Water Mgt 43:99-109.
Leonforte, A. 2013. A study of salinity tolerance in field pea. Ph.D. Thesis, The University of Adelaide, Australia. https://minervaaccess.unimelb.edu.au/bitstream/handle/11343/38605/307726_PHD%20Thesis%20 Antonio%20Leonforte.pdf?sequence=1&isAllowed=y (Accessed February 2019).
McElgunn, J.D., and T. Lawrence. 1973. Salinity tolerance of altai wild ryegrass and other forage grasses. Can. J. Pl. Sci. 53:303-307. doi:10.4141/cjps73-056
Rameshwaran, P., M. Qadir, R. Ragab, A. Arslan, G.A. Majid and K. Abdallah. 2016. Tolerance of faba bean, chickpea, and lentil to salinity: Accessions’ salinity response functions. Irrig. and Drain. 65:49-60. Doi:10/1002/ird.1922
Riedell, W.E. 2016. Growth and ion accumulation responses of four grass species to salinity. J. Plant Nut. 39:2115-2125. Doi:10.1080/01904167. 2016.1193611
Royo, A., R. Aragues, E. Playan and R. Ortiz. 2000. Salinity-grain yield response functions of barley cultivars assessed with a drip-injection irrigation system. Soil Sci. Soc. Am. J. 64:359-365.
Sanden, B., and B. Sheesley. 2007. Salinity tolerance and management for alfalfa. In Proceedings, 38th California Alfalfa and Forage Symposium, Dec. 2-4, 2007. San Diego, Calif. UC Coop. Ext. Agron. Res. and Ext. Center, Plant Sci. Dept., Univ. Cal. Davis. https://alfalfa.ucdavis.edu/+symposium/proceedings/2008/08-103.pdf (Accessed April, 2019).
Steppuhn, H., and J.P. Raney. 2005. Emergence, height, and yield of canola and barley grown in saline root zones. Can. Plant Sci. 85:815-827.
Steppuhn, H., K.M. Volkmar and P.R. Miller. 2001. Comparing canola, field pea, dry bean and durum wheat crops grown in saline media. Crop Sci. 41:1827-1833.
Steppuhn, H., P.G. Jefferson, A.D. Iwaasa and J.G. McLeod. 2006. AC Saltlander green wheatgrass. Can. J. Plant Sci. 86:1161-1164.
Steppuhn, H., S.N. Acharya, A.D. Iwaasa, M. Gruber and D.R. Miller. 2012. Inherent responses to root-zone salinity in nine alfalfa populations. Can. J. Plant Sci. 92:235-248.
Thapa, R., A. Wick, A. Chatterjee, T. DeSutter and C. Langseth. 2016. Spring wheat response to salinity. NDSU Extension publication Soil Health and Land Management. www.ndsu.edu/soilhealth/wp-content/uploads/2015/12/wheat-salinity_6-13-16.pdf (Accessed February 2019).
U.S. Salinity Lab. 1954. Diagnosis and Improvement of Saline and Alkali Soils. USDA Agric. Handbook No. 60. Washington, D.C.
For more information on this and other topics, see www.ndsu.edu/extension
